Fallstudie: e-xode.net
Vollständiges Audit von www.e-xode.net, durchgeführt am 27. Februar 2026 mit Lighthouse 13. Ein 28-seitiger Bericht zu Performance, Barrierefreiheit, SEO und Best Practices auf Mobil und Desktop.
Audit-Übersicht
VitaPulse erstellte einen 28-seitigen PDF-Bericht für www.e-xode.net mit Lighthouse 13. Der Bericht umfasst Mobil und Desktop: Scores, Core Web Vitals, Performance-Erkenntnisse, Diagnosen, Qualitätsprobleme, Ressourcenaufschlüsselung und Regressionserkennung. Dasselbe Format wie jedes VitaPulse-Audit — der teilbare Bericht, den Ihre Kunden ohne Konto lesen können.
Wichtige Audit-Metriken
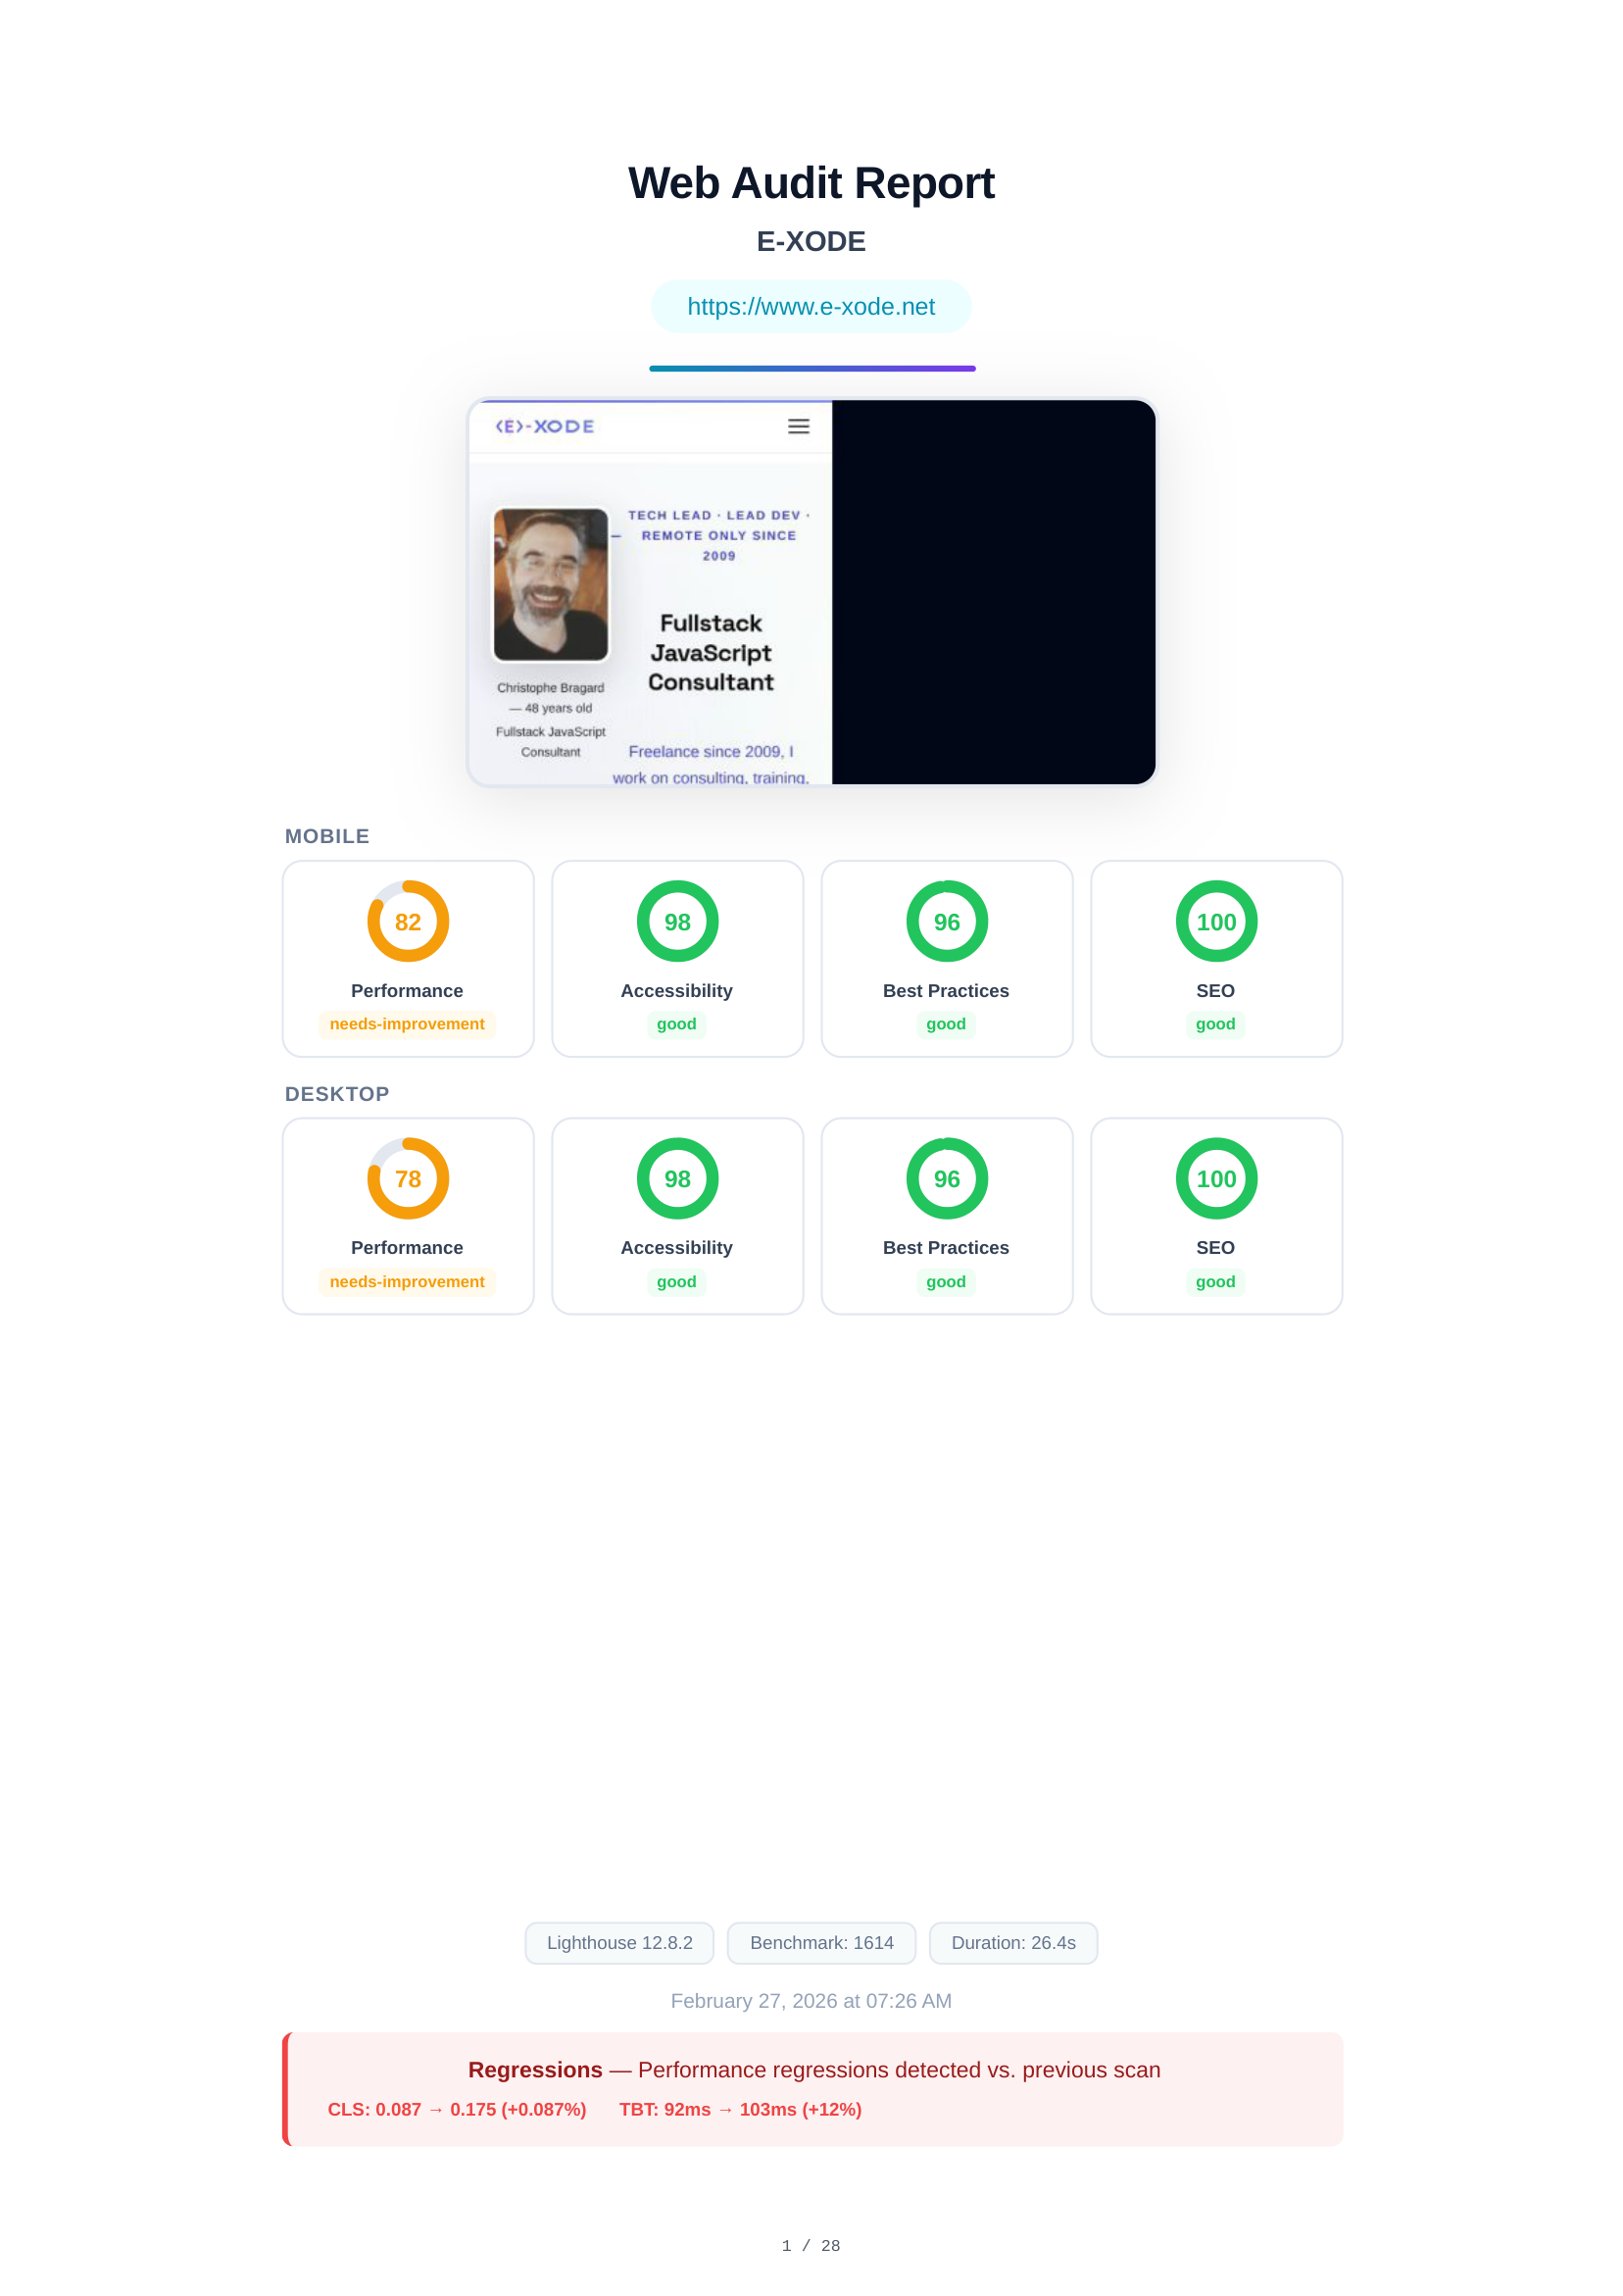
Audit-Deckblatt & Scores-Übersicht
Das Deckblatt zeigt die auditierte URL (www.e-xode.net), einen ganzseitigen Screenshot sowie eine Zusammenfassung aller Lighthouse-Scores für Mobil und Desktop. Mobil: Performance 82, Barrierefreiheit 98, Best Practices 96, SEO 100. Desktop: Performance 78, Barrierefreiheit 98, Best Practices 96, SEO 100.
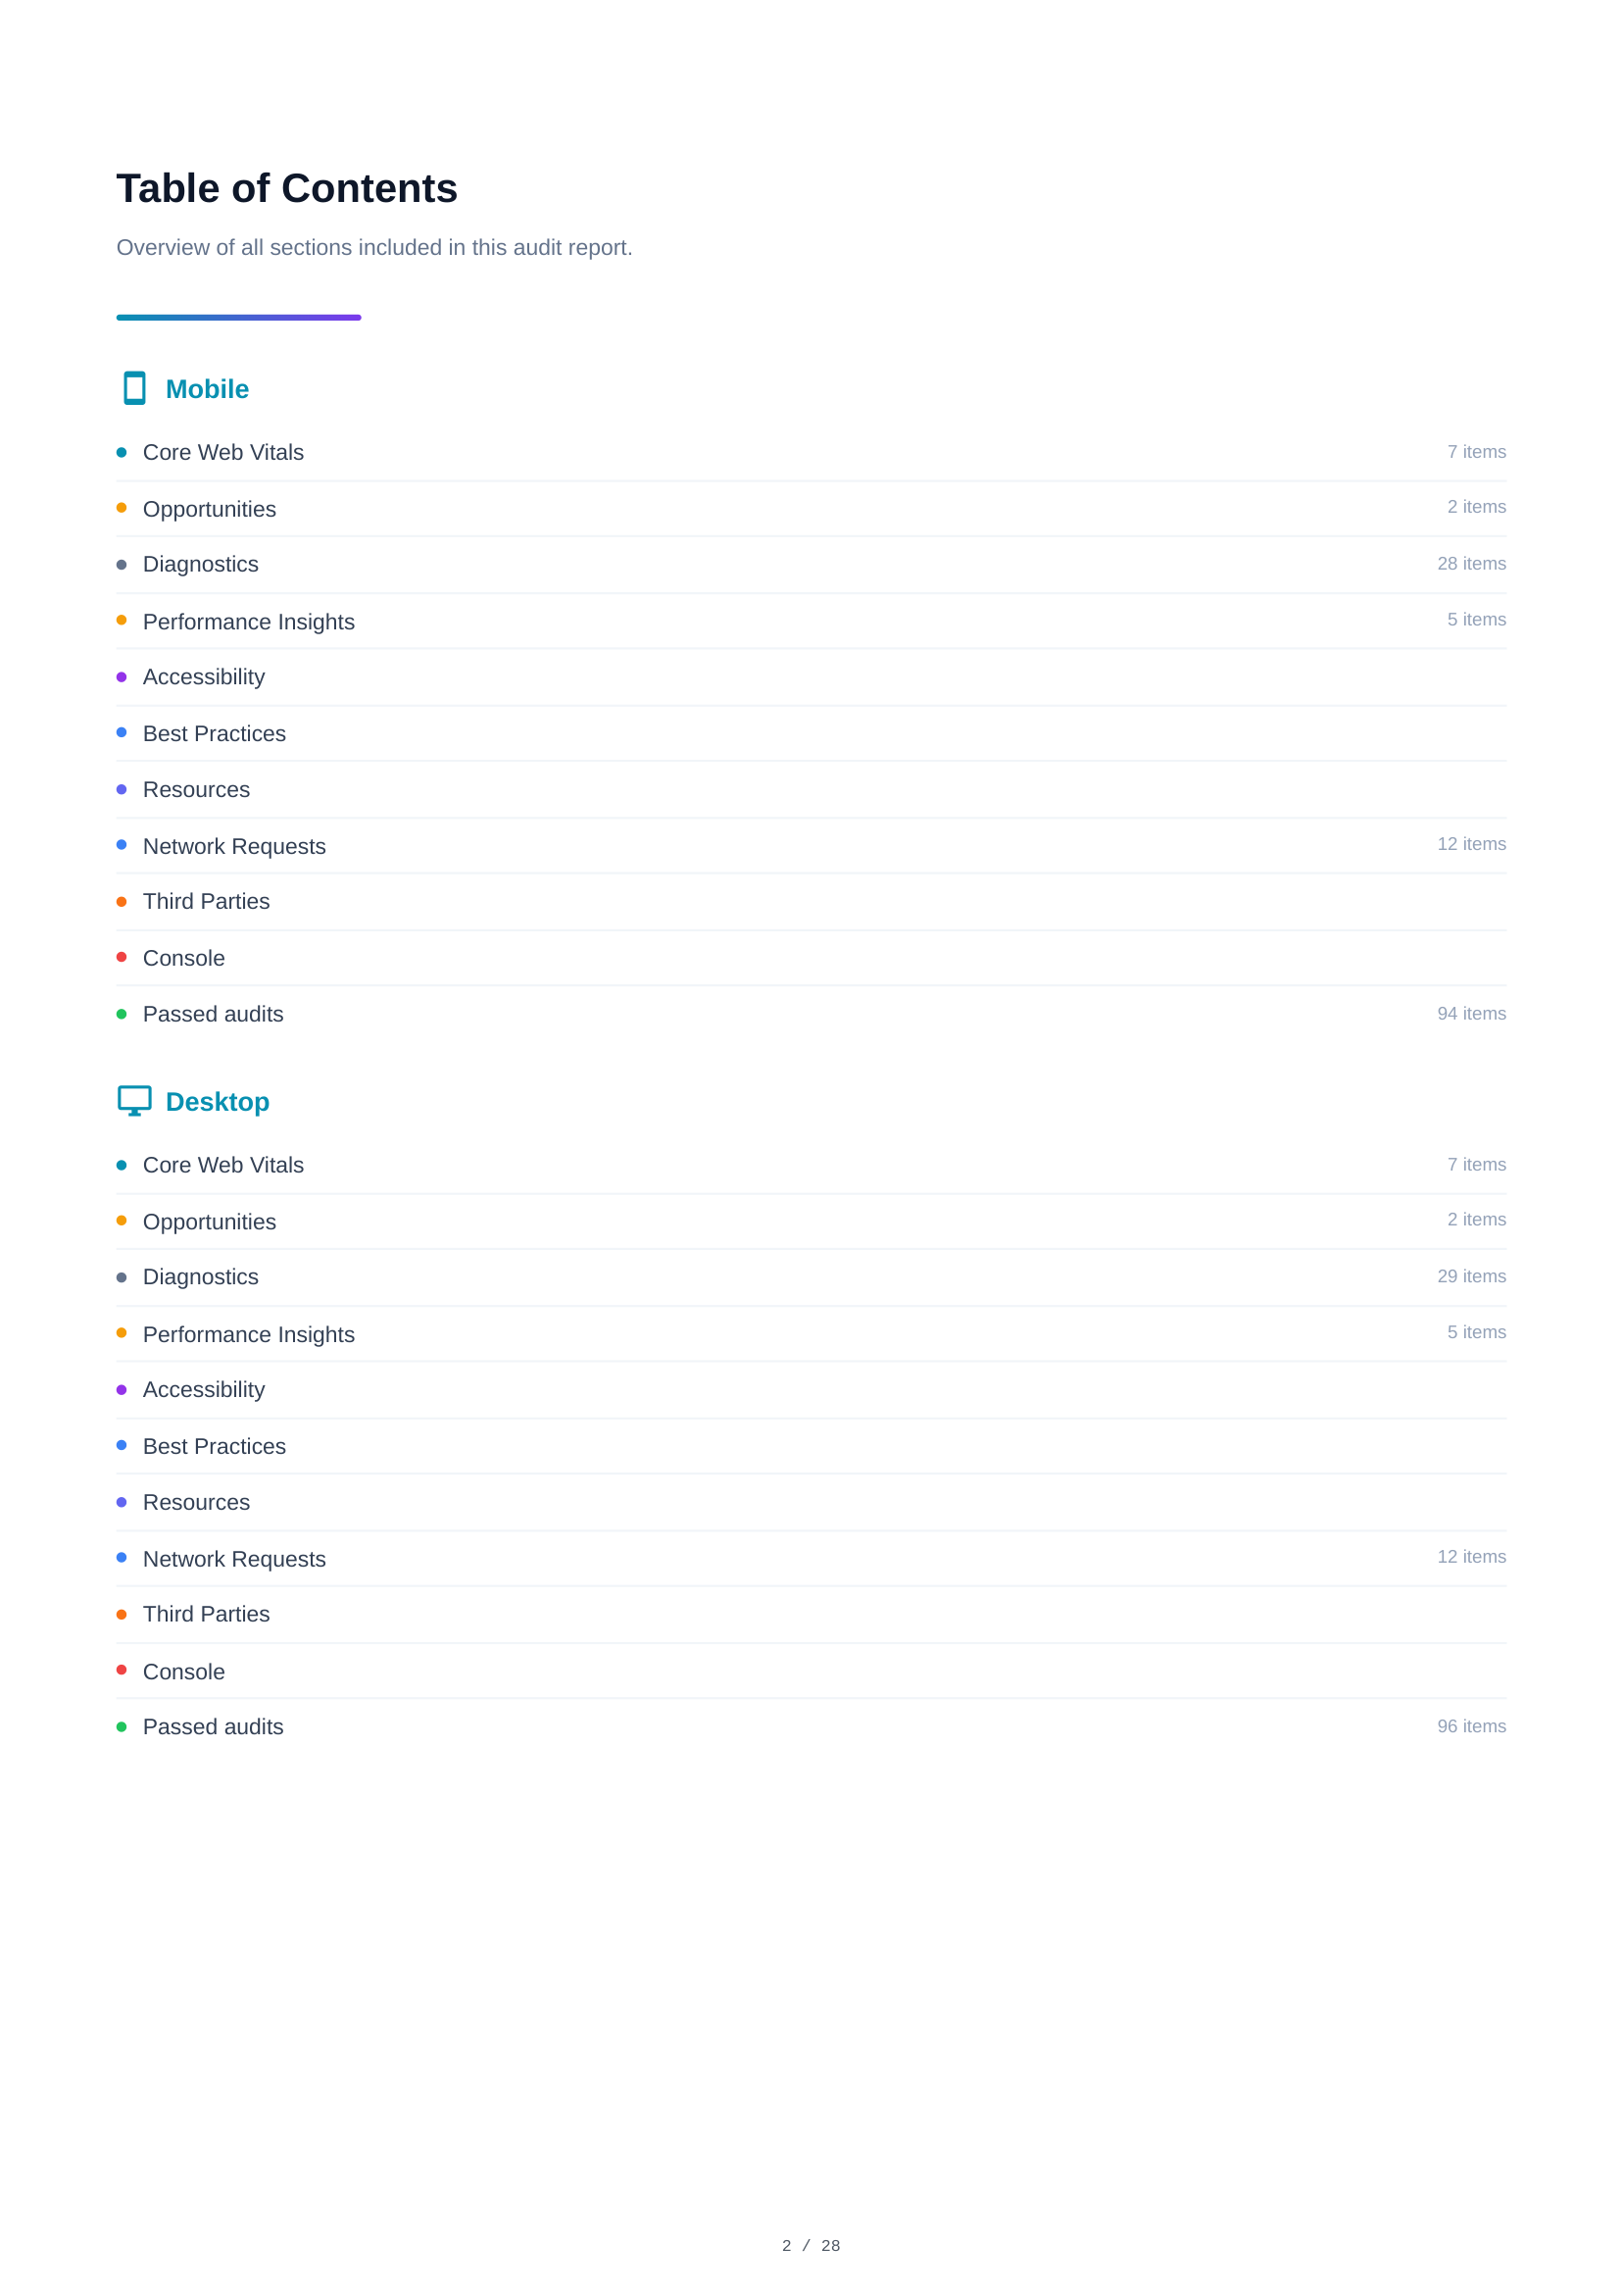
Inhaltsverzeichnis
Das Inhaltsverzeichnis bietet eine navigierbare Übersicht aller Berichtsabschnitte. Es listet jede Audit-Kategorie mit Anzahl der Einträge auf — Core Web Vitals, Optimierungsmöglichkeiten, Diagnosen, Performance-Erkenntnisse, Barrierefreiheit, Best Practices, SEO, Ressourcen und mehr — für Mobil und Desktop.
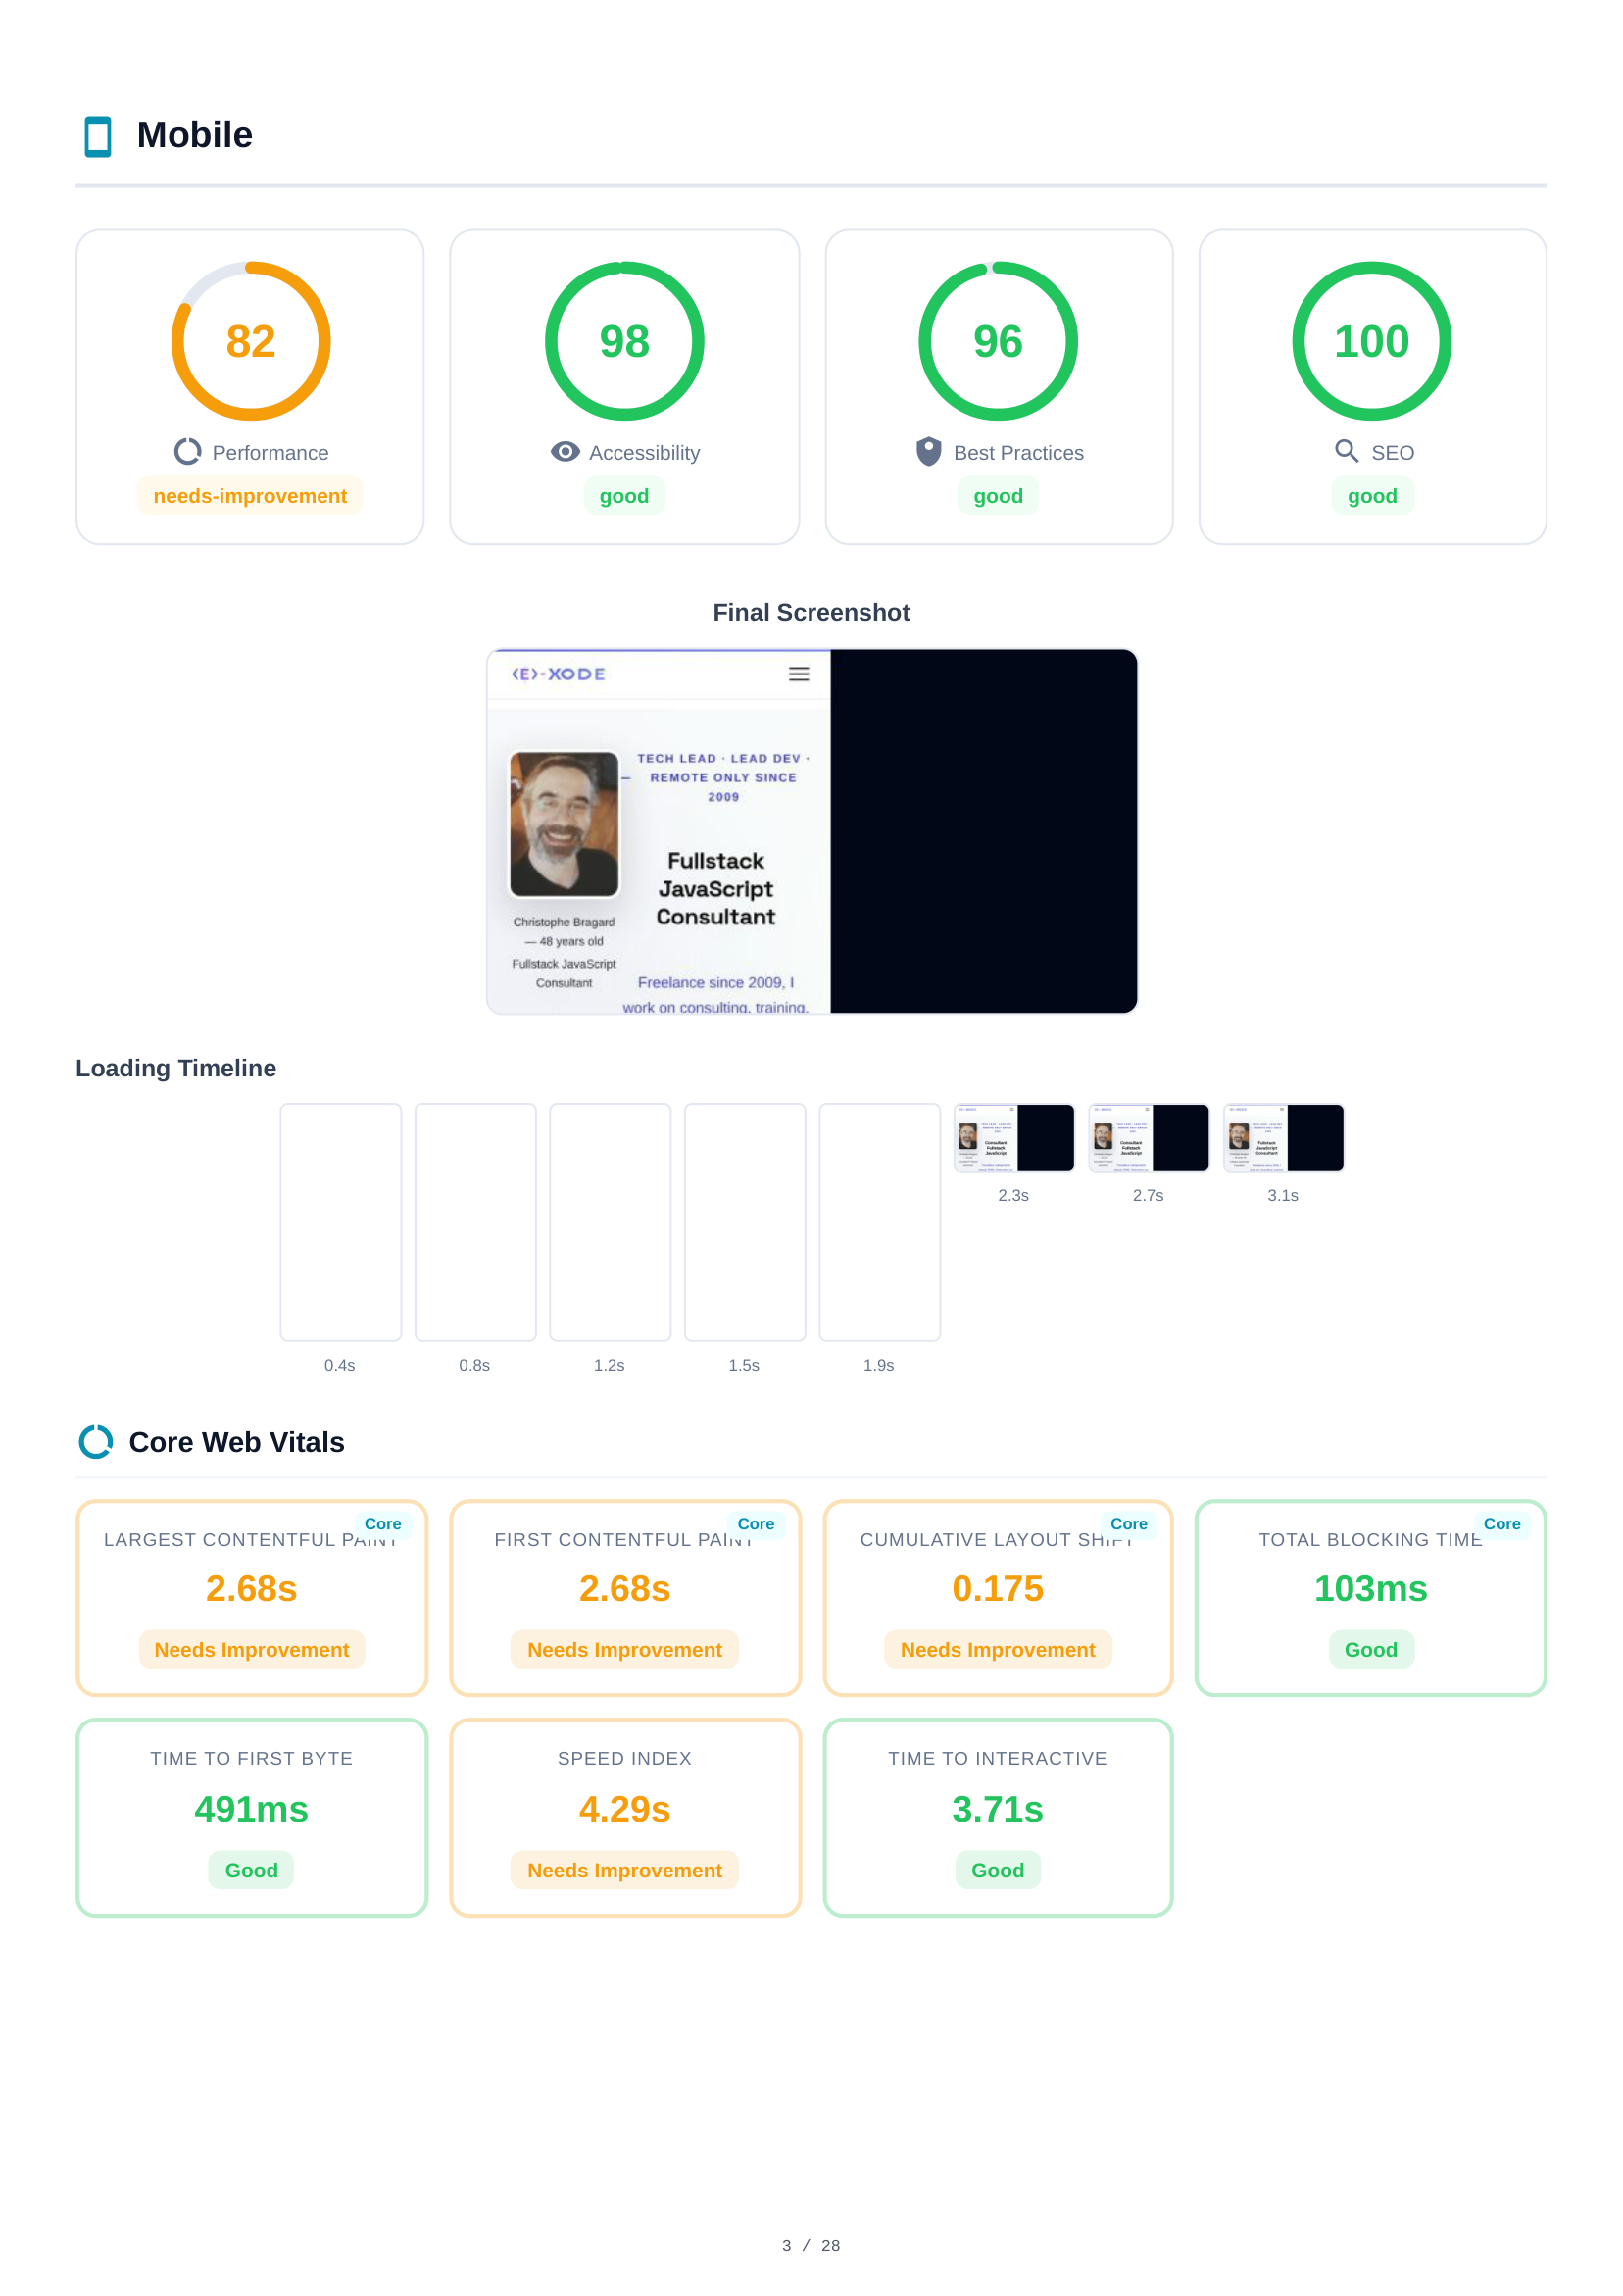
Mobile Scores & Core Web Vitals
Die Mobile-Analyse beginnt mit 4 Lighthouse-Scores — Performance (82), Barrierefreiheit (98), Best Practices (96), SEO (100) — dargestellt als farbcodierte Messanzeigen. Darunter visualisieren ein abschließender Screenshot und eine Lade-Zeitachse das Rendering der Seite im Zeitverlauf. Es folgen die Core Web Vitals: Largest Contentful Paint (LCP), Cumulative Layout Shift (CLS), Total Blocking Time (TBT), First Contentful Paint (FCP) und Speed Index.
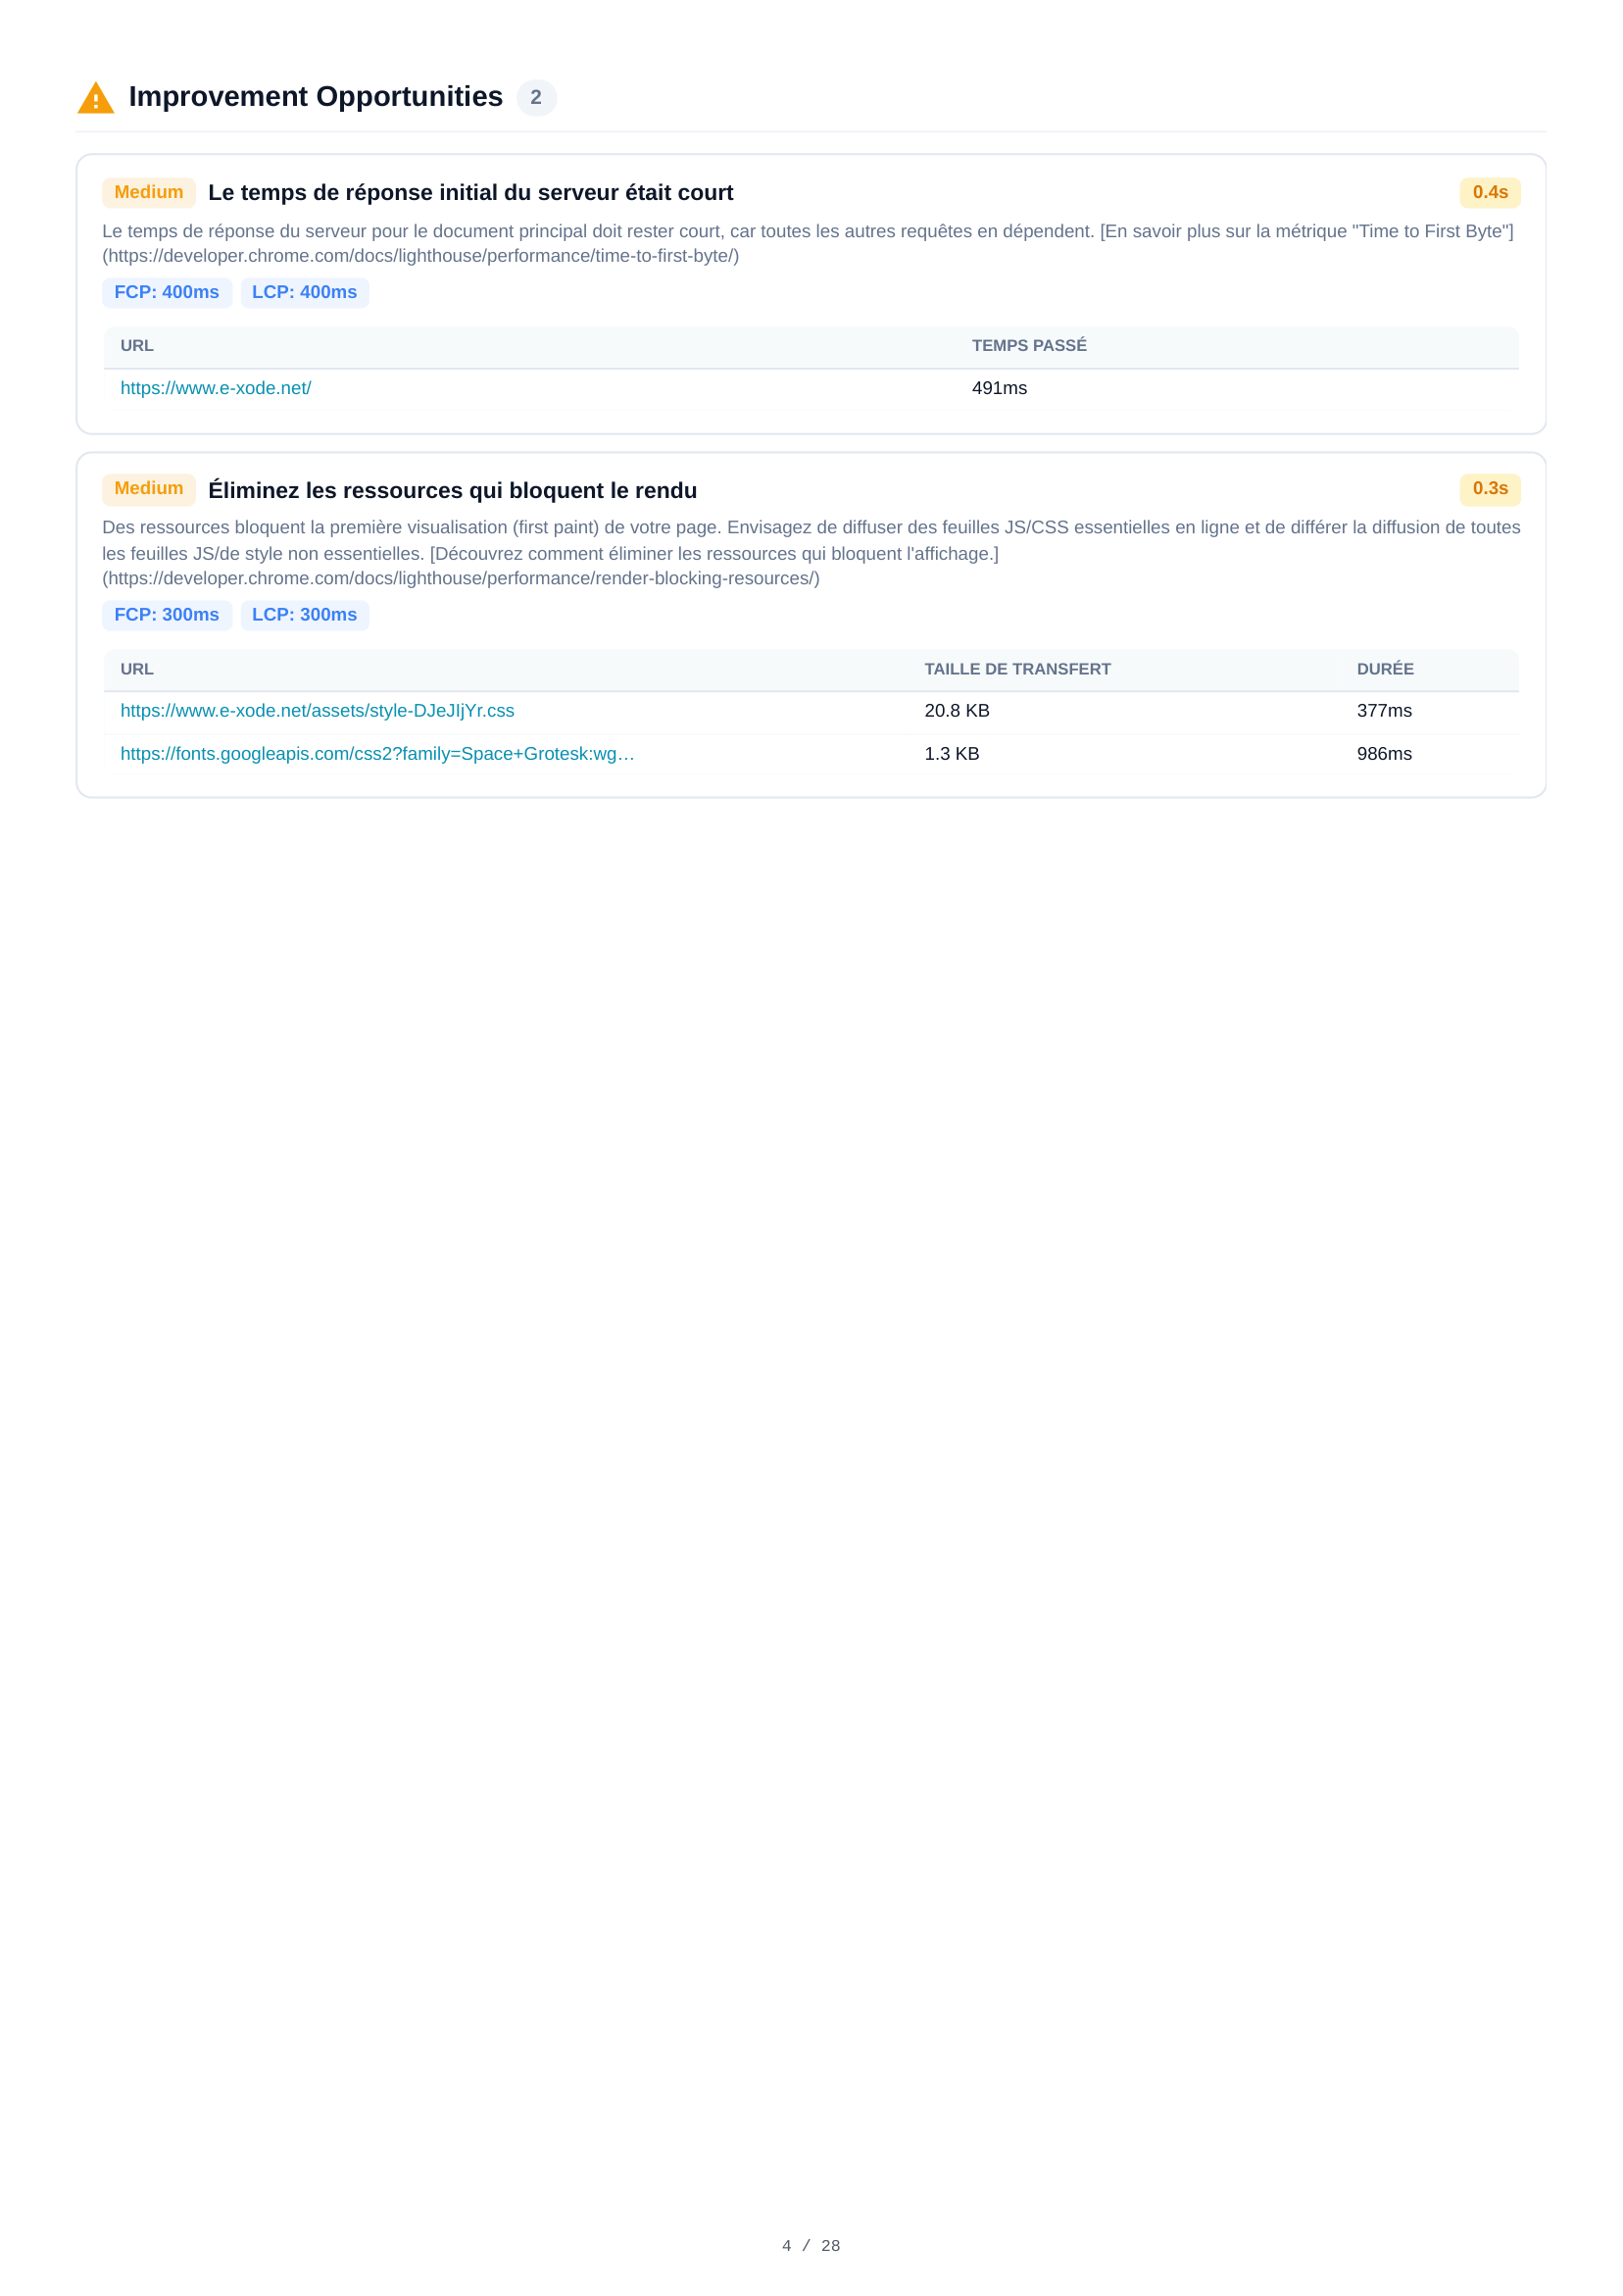
Mobile Optimierungsmöglichkeiten
Zwei Optimierungsmöglichkeiten werden für Mobil identifiziert. Jede enthält einen Schweregrad, eine Beschreibung und geschätzte Zeitersparnis. Wesentliche Erkenntnisse umfassen die Analyse der Server-Antwortzeit und Empfehlungen zur Optimierung der Ressourcenbereitstellung zur Verbesserung der Ladeperformance.
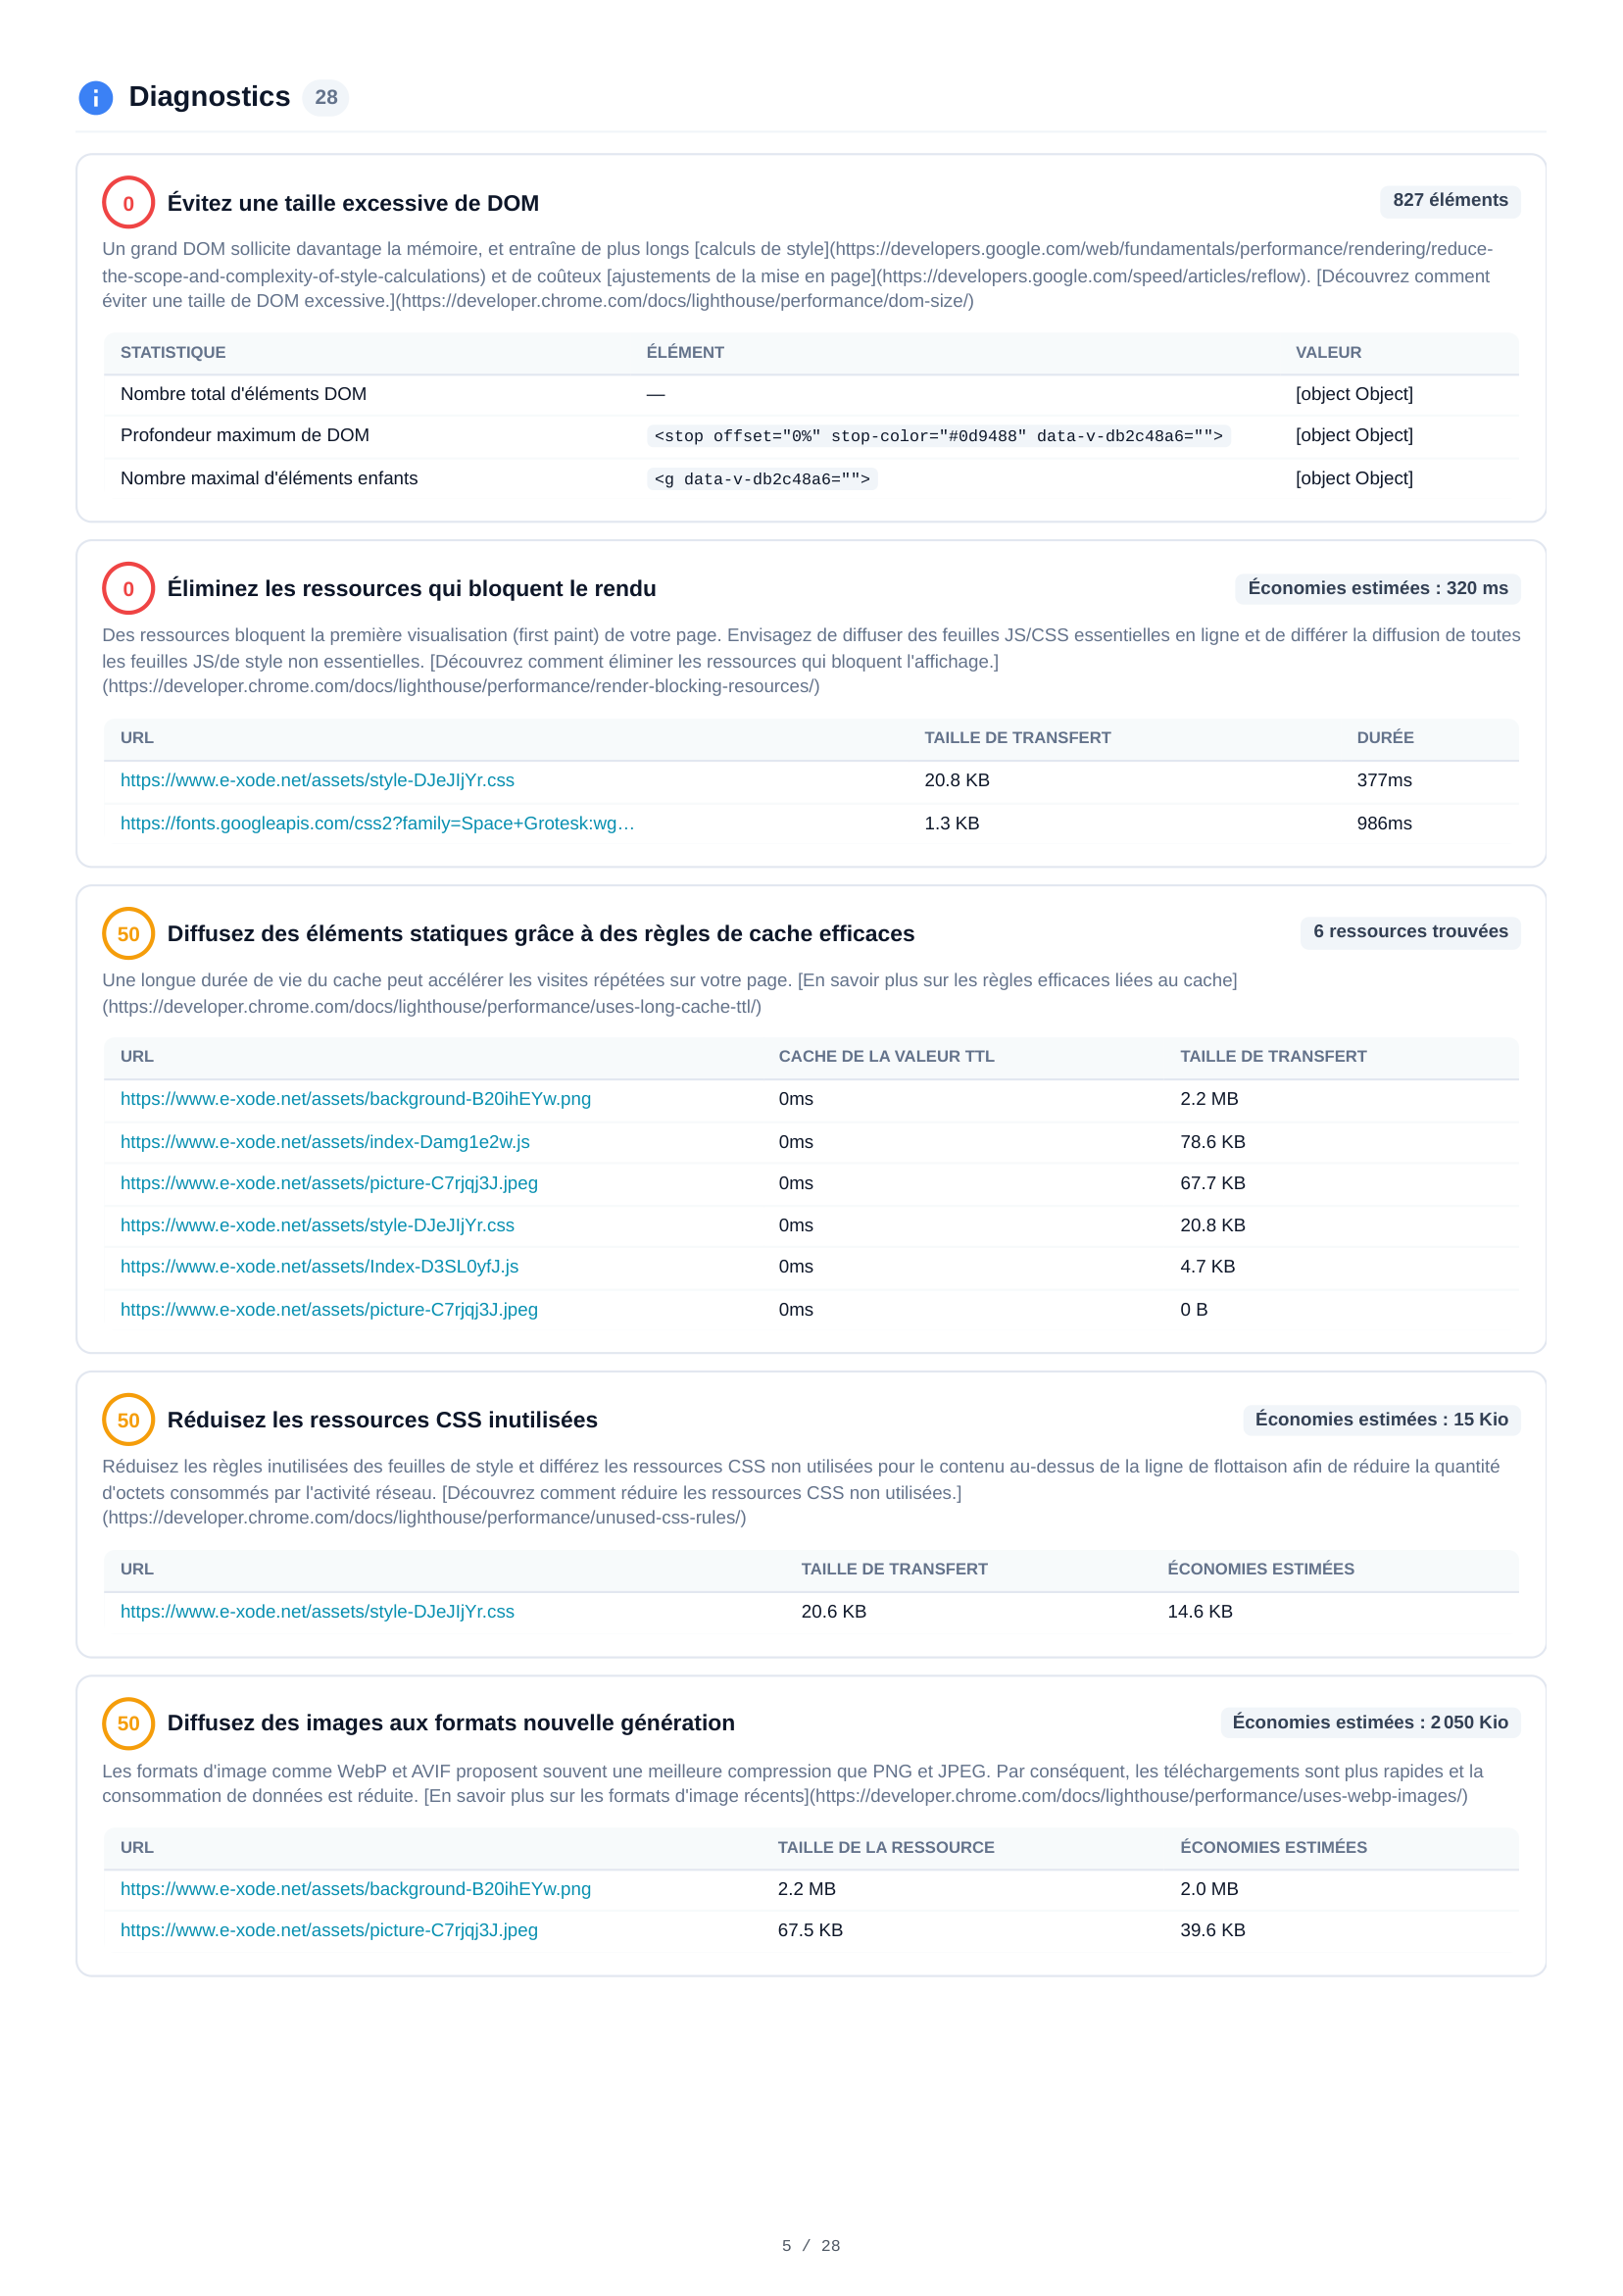

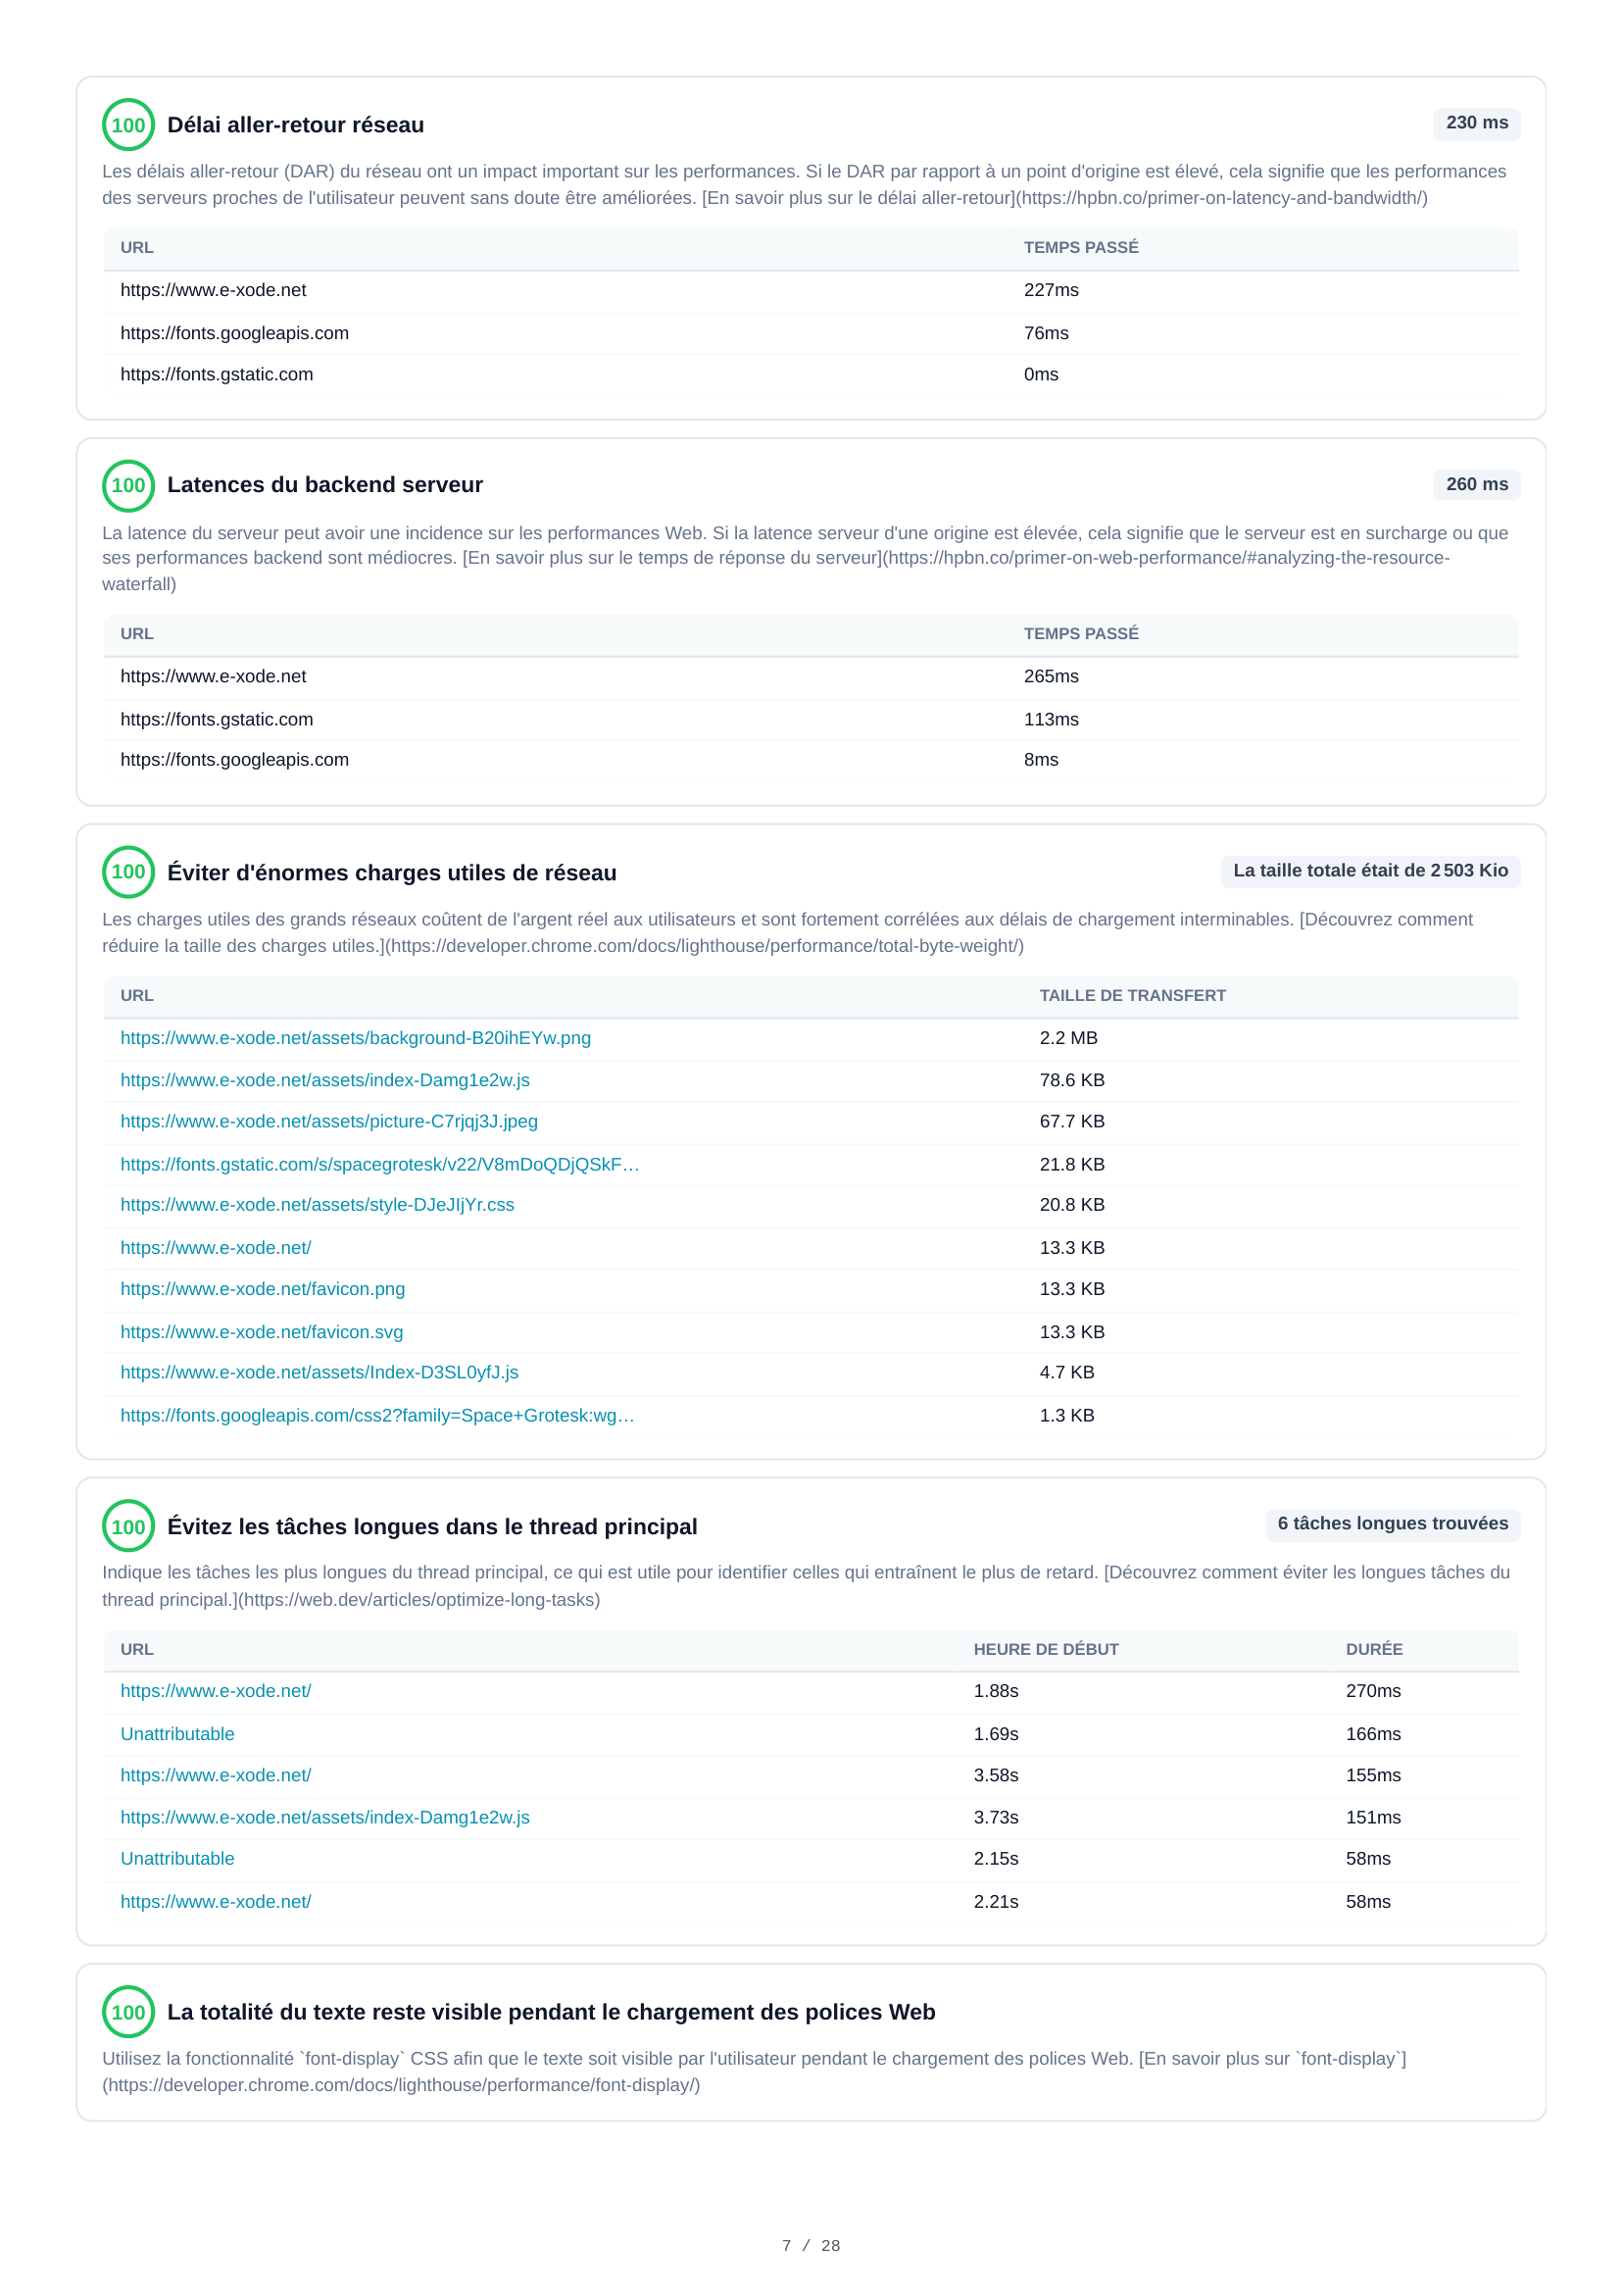
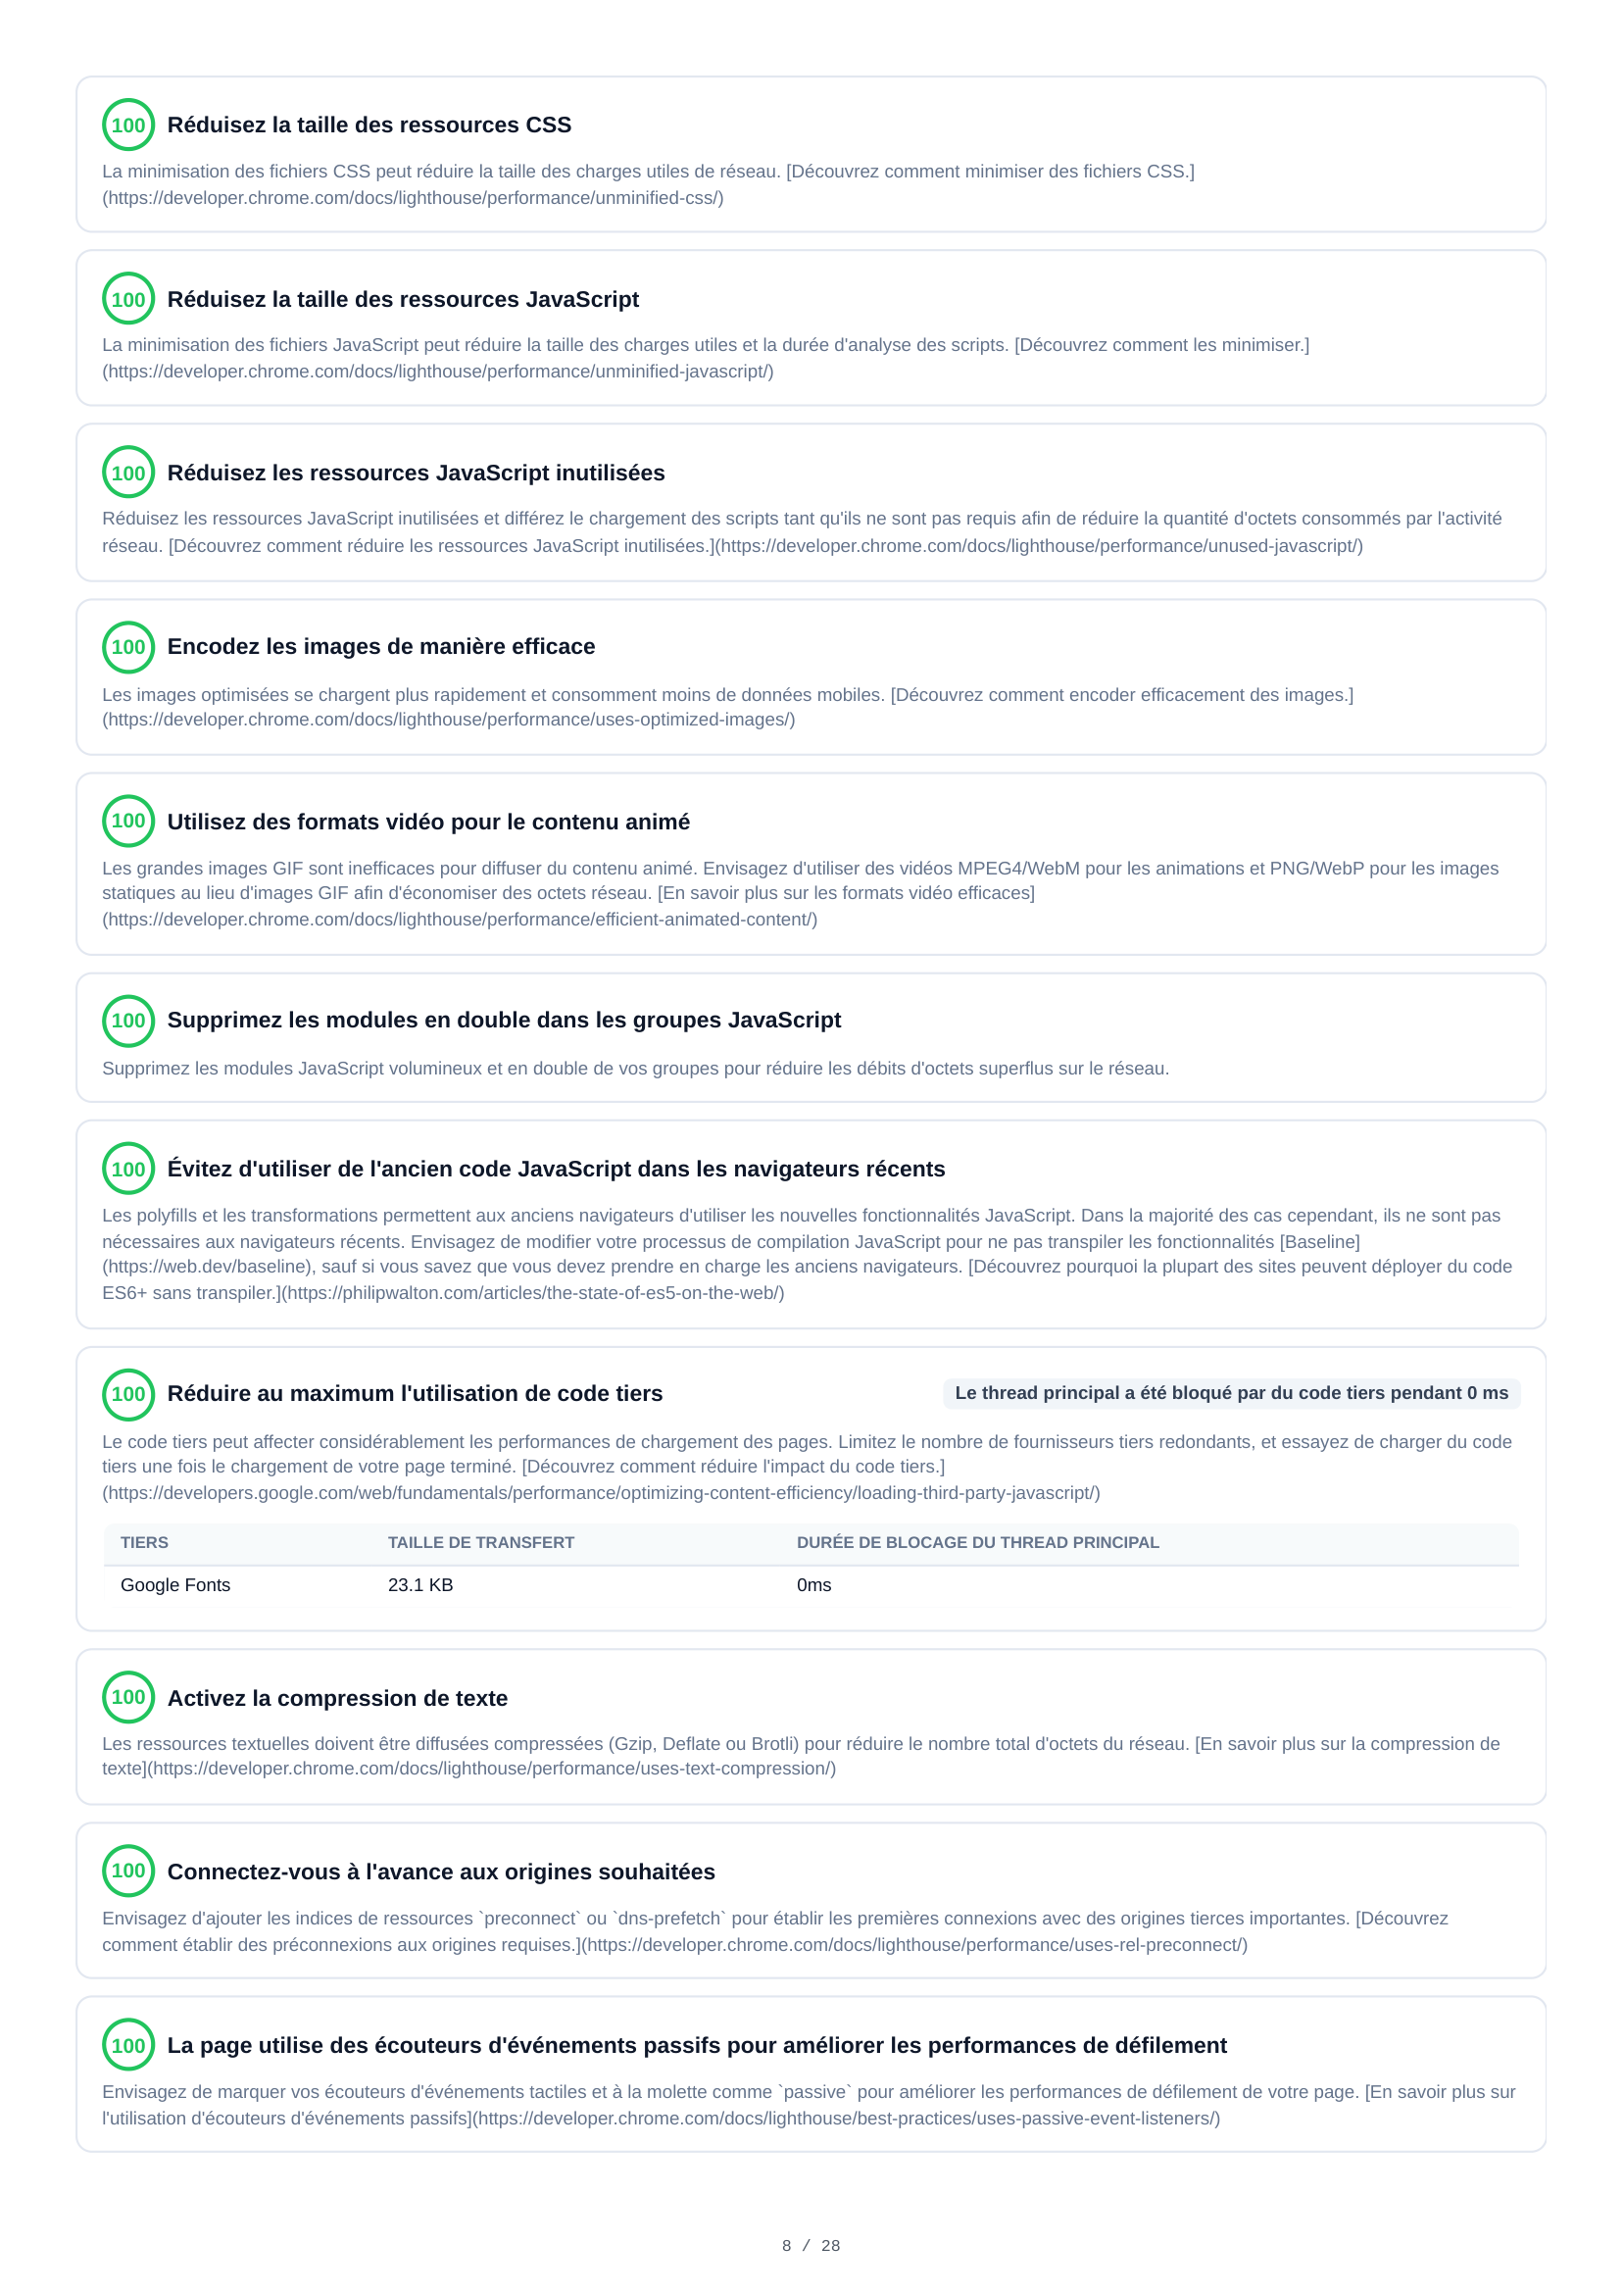
Mobile Diagnosen
28 Diagnose-Audits erstrecken sich über 5 Seiten und liefern eine tiefgehende Mobile-Performance-Analyse. Wesentliche Erkenntnisse: übermäßige DOM-Größe (827 Elemente), Probleme bei der Bildgröße, CSS- und JavaScript-Optimierung, Netzwerk-Roundtrip-Verzögerungen, render-blockierende Ressourcen, fehlende Cache-Richtlinien sowie detaillierte Audits zu jedem Aspekt der Seitenperformance.
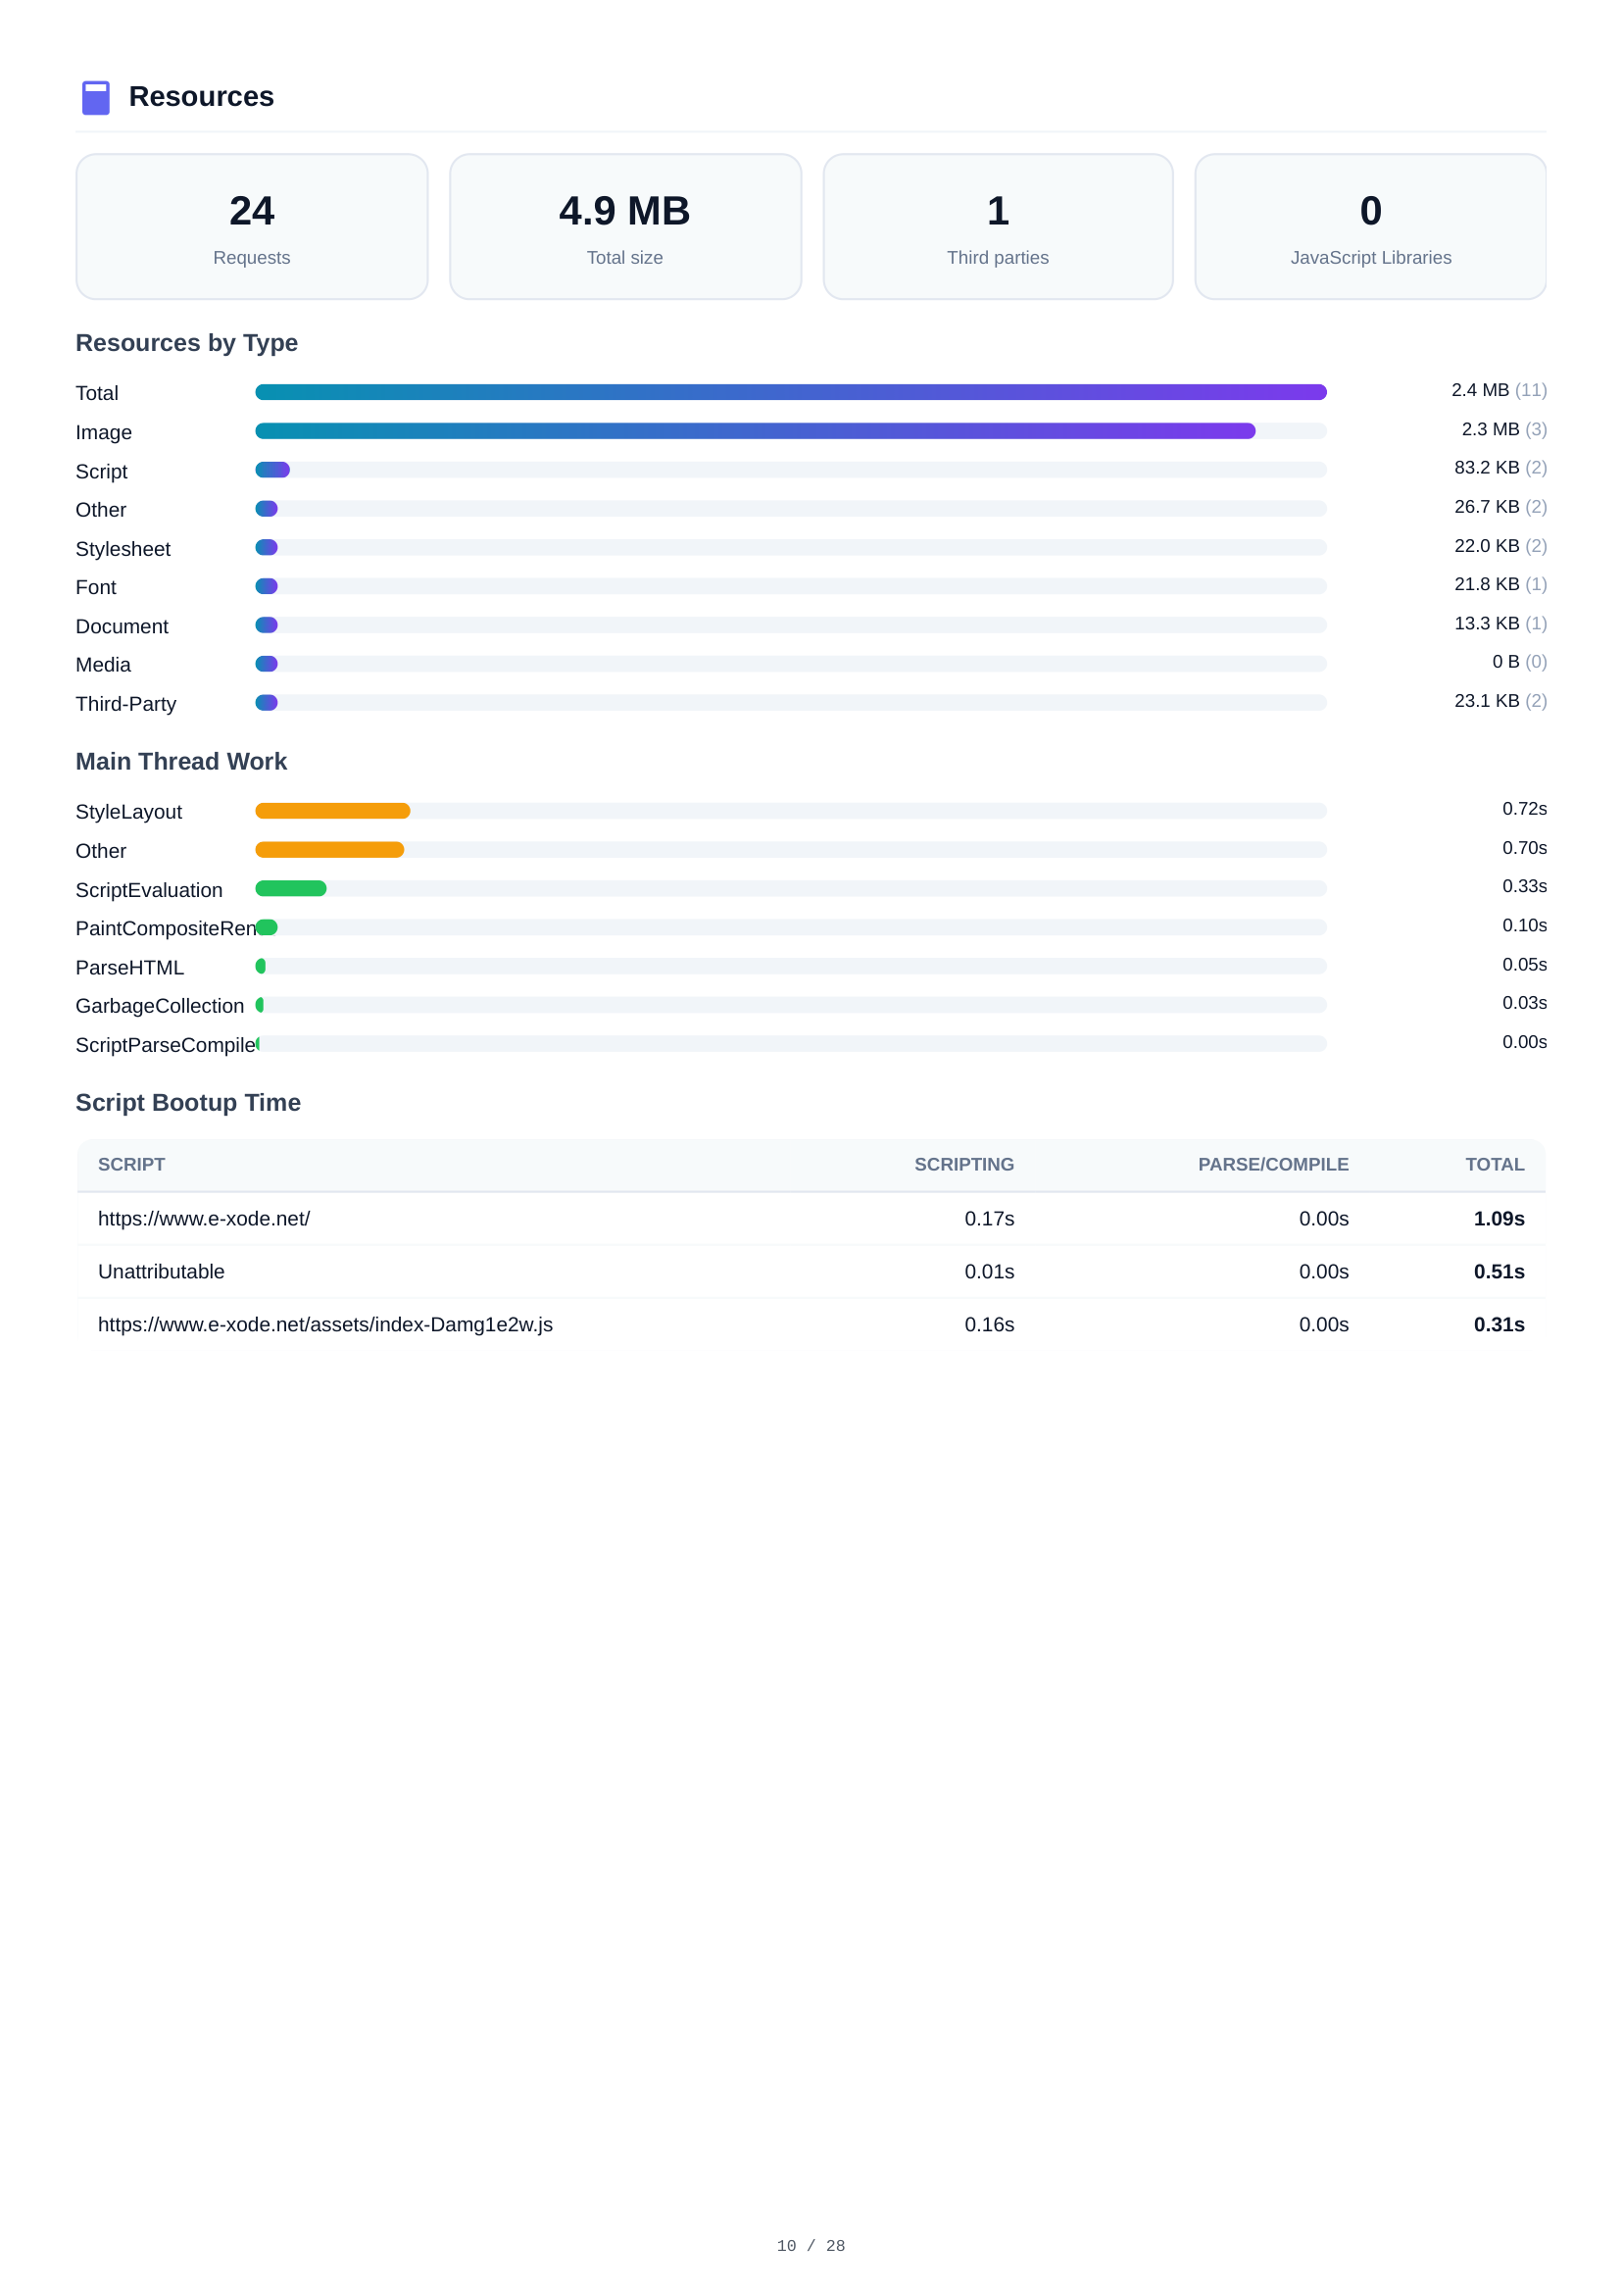
Mobile Ressourcen
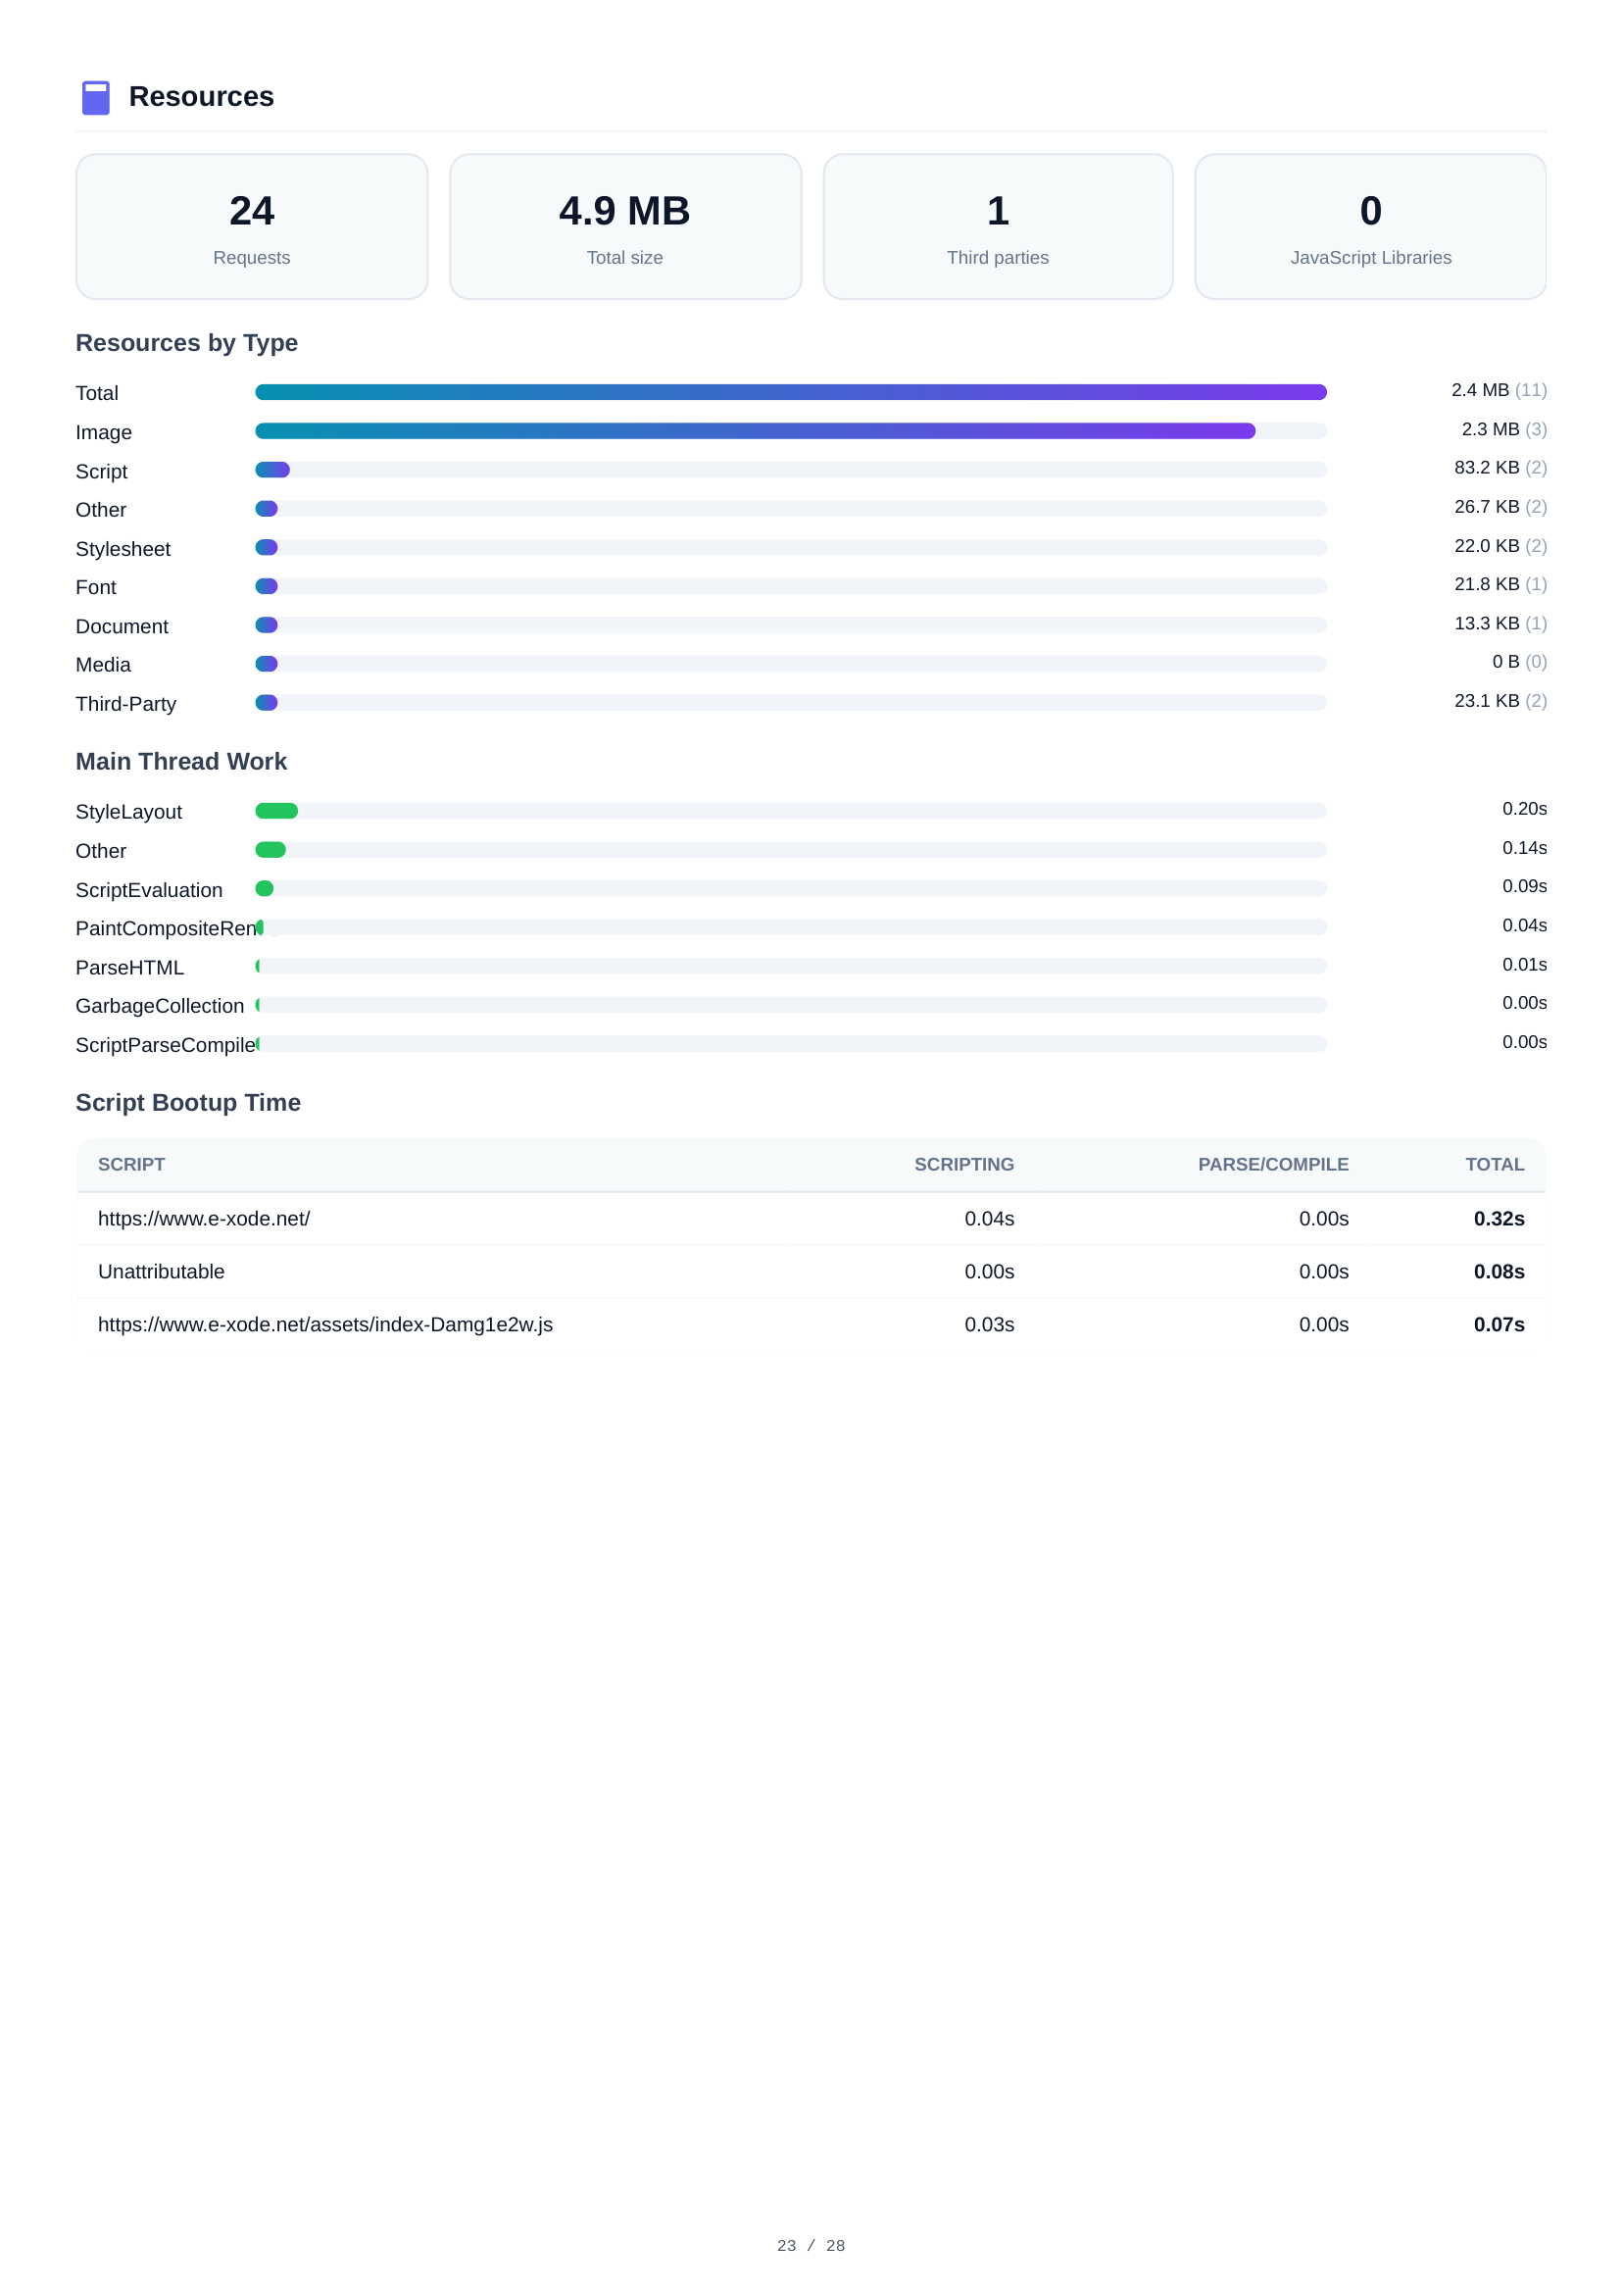
Ein vollständiges Ressourceninventar mit 24 Anfragen und insgesamt 4,9 MB. Aufschlüsselung nach Typ: Bilder (2,4 MB, 11 Dateien), Skripte (2,3 MB, 3 Dateien), Sonstiges (83,2 KB), Stylesheets (26,7 KB) und Schriften (22,0 KB). Die Drittanbieter-Analyse identifiziert externe Abhängigkeiten.
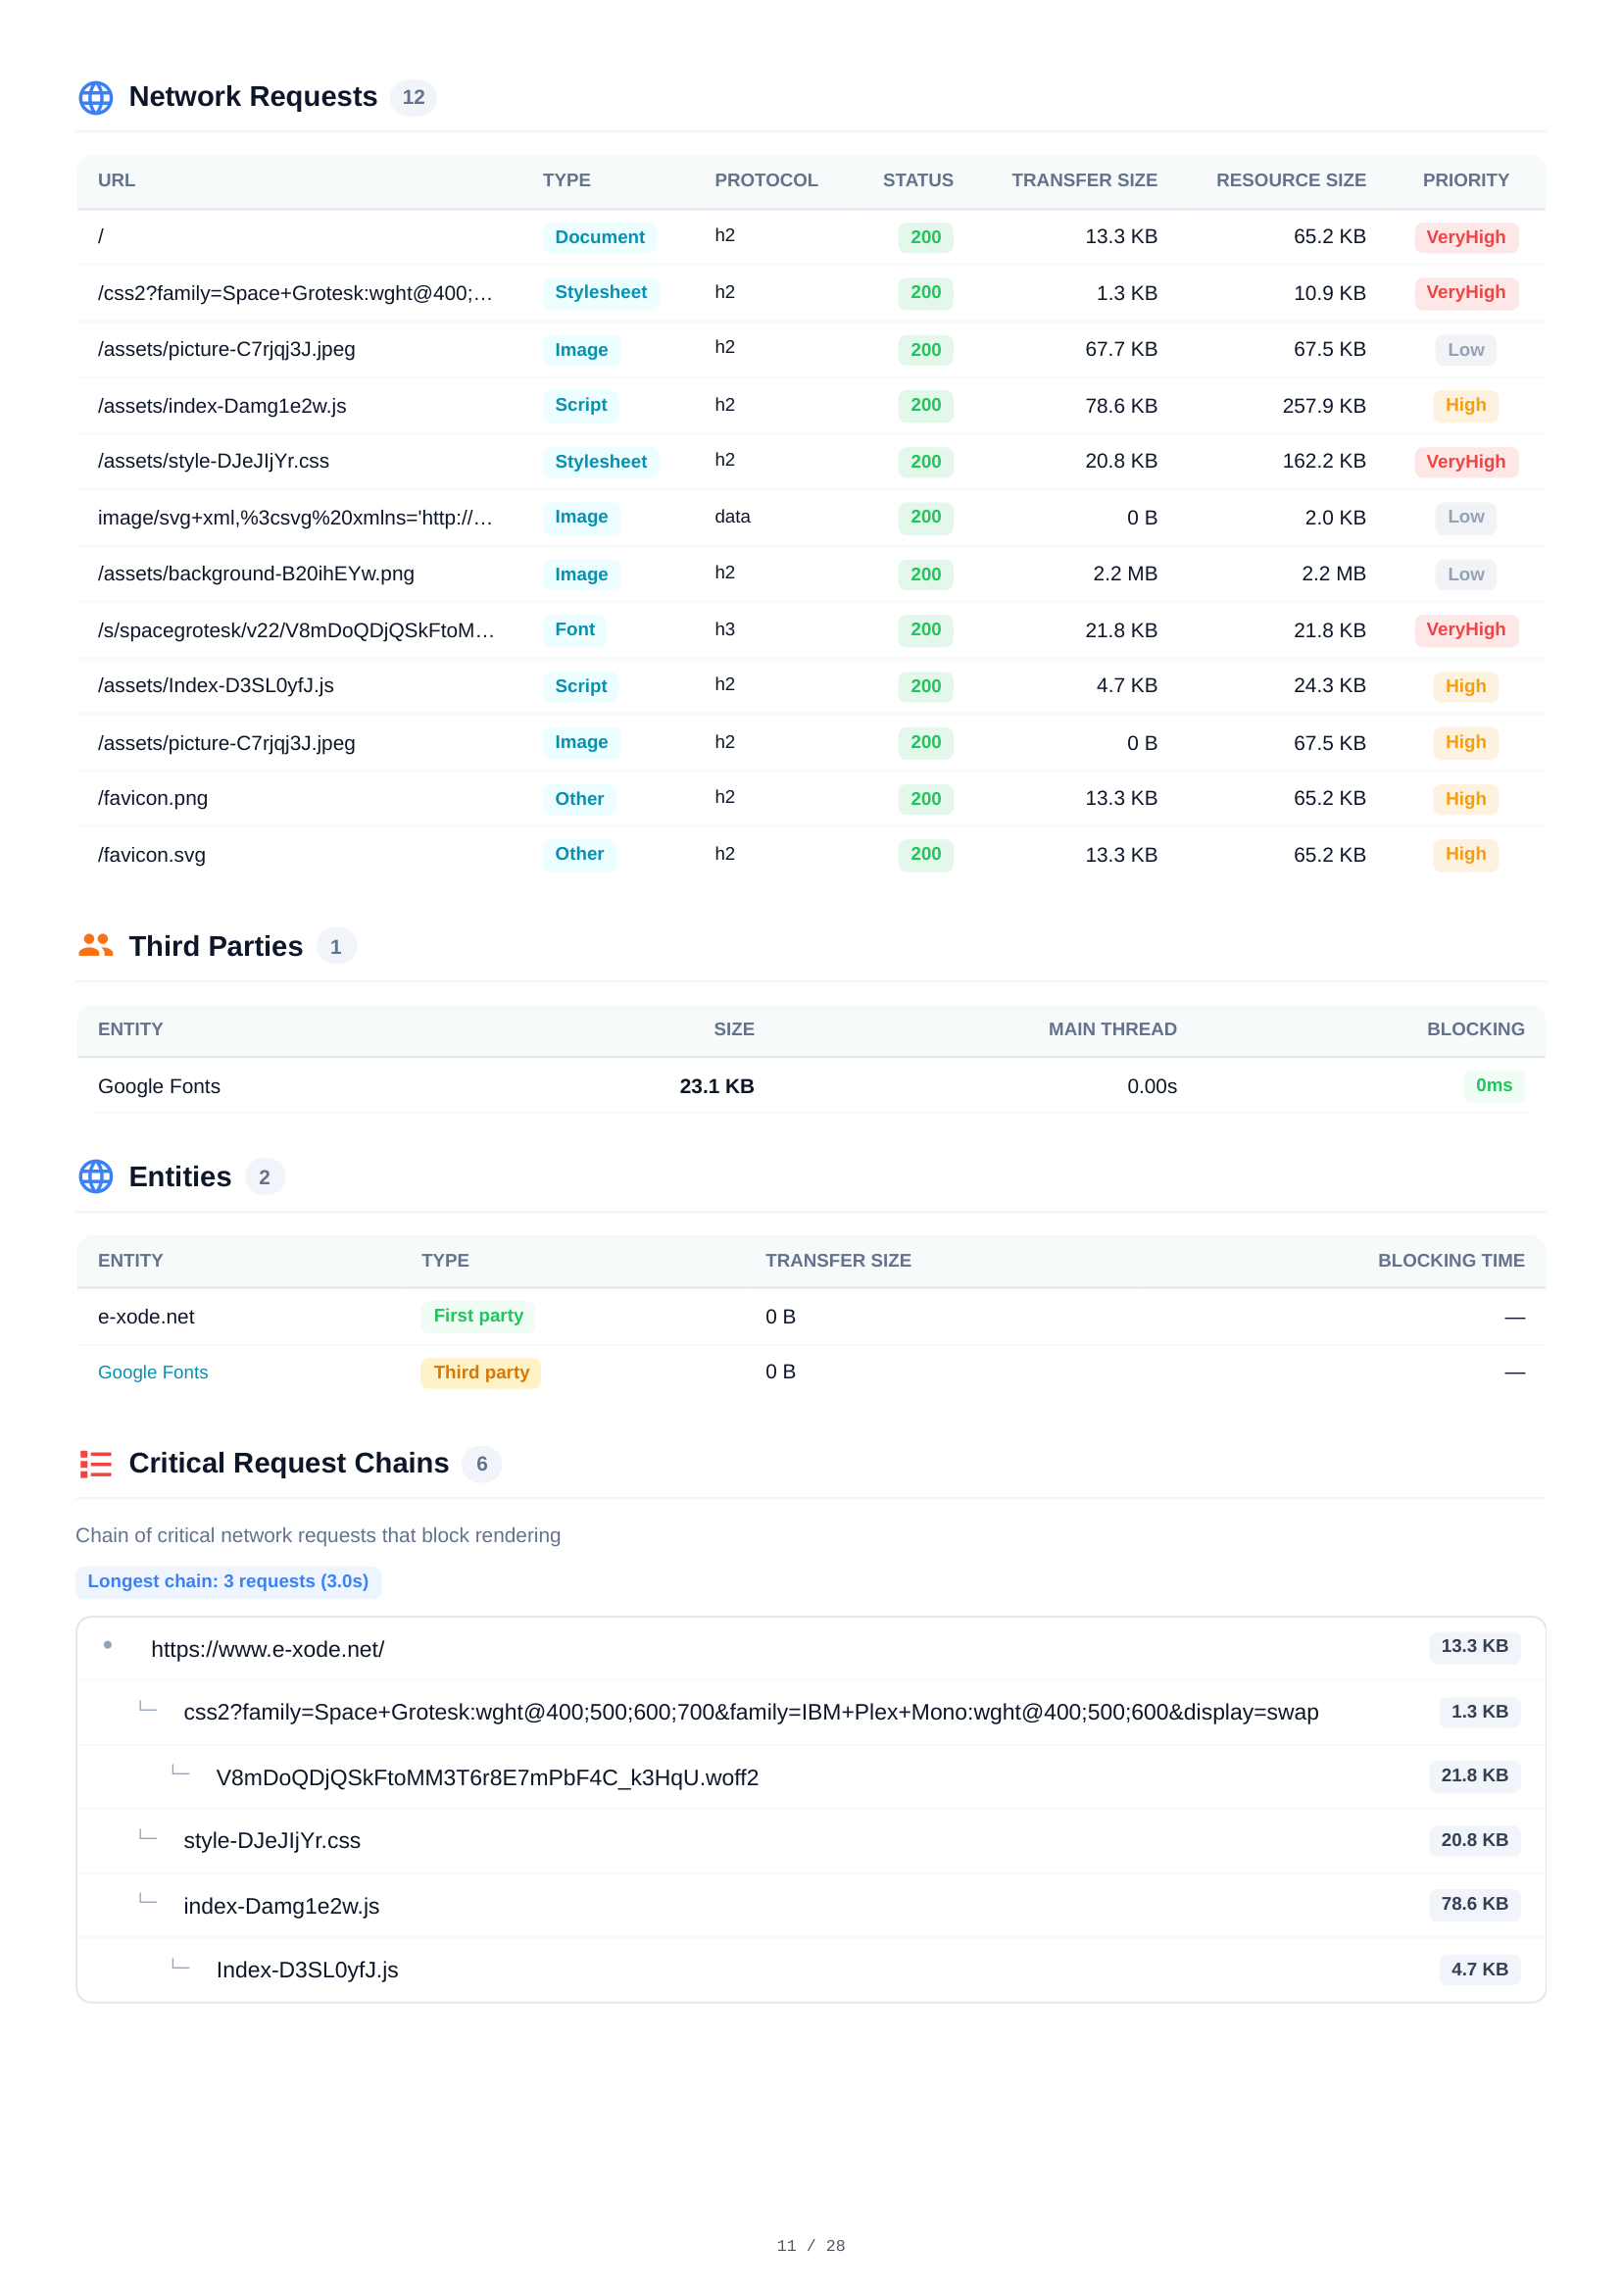
Mobile Netzwerkanfragen
Eine detaillierte Tabelle aller 12 HTTP-Anfragen beim Mobile-Seitenaufruf. Jede Anfrage zeigt URL, Ressourcentyp, Protokoll (h2), HTTP-Status, Übertragungsgröße, Ressourcengröße und Ladepriorität — mit vollständiger Transparenz über den Netzwerk-Wasserfall.
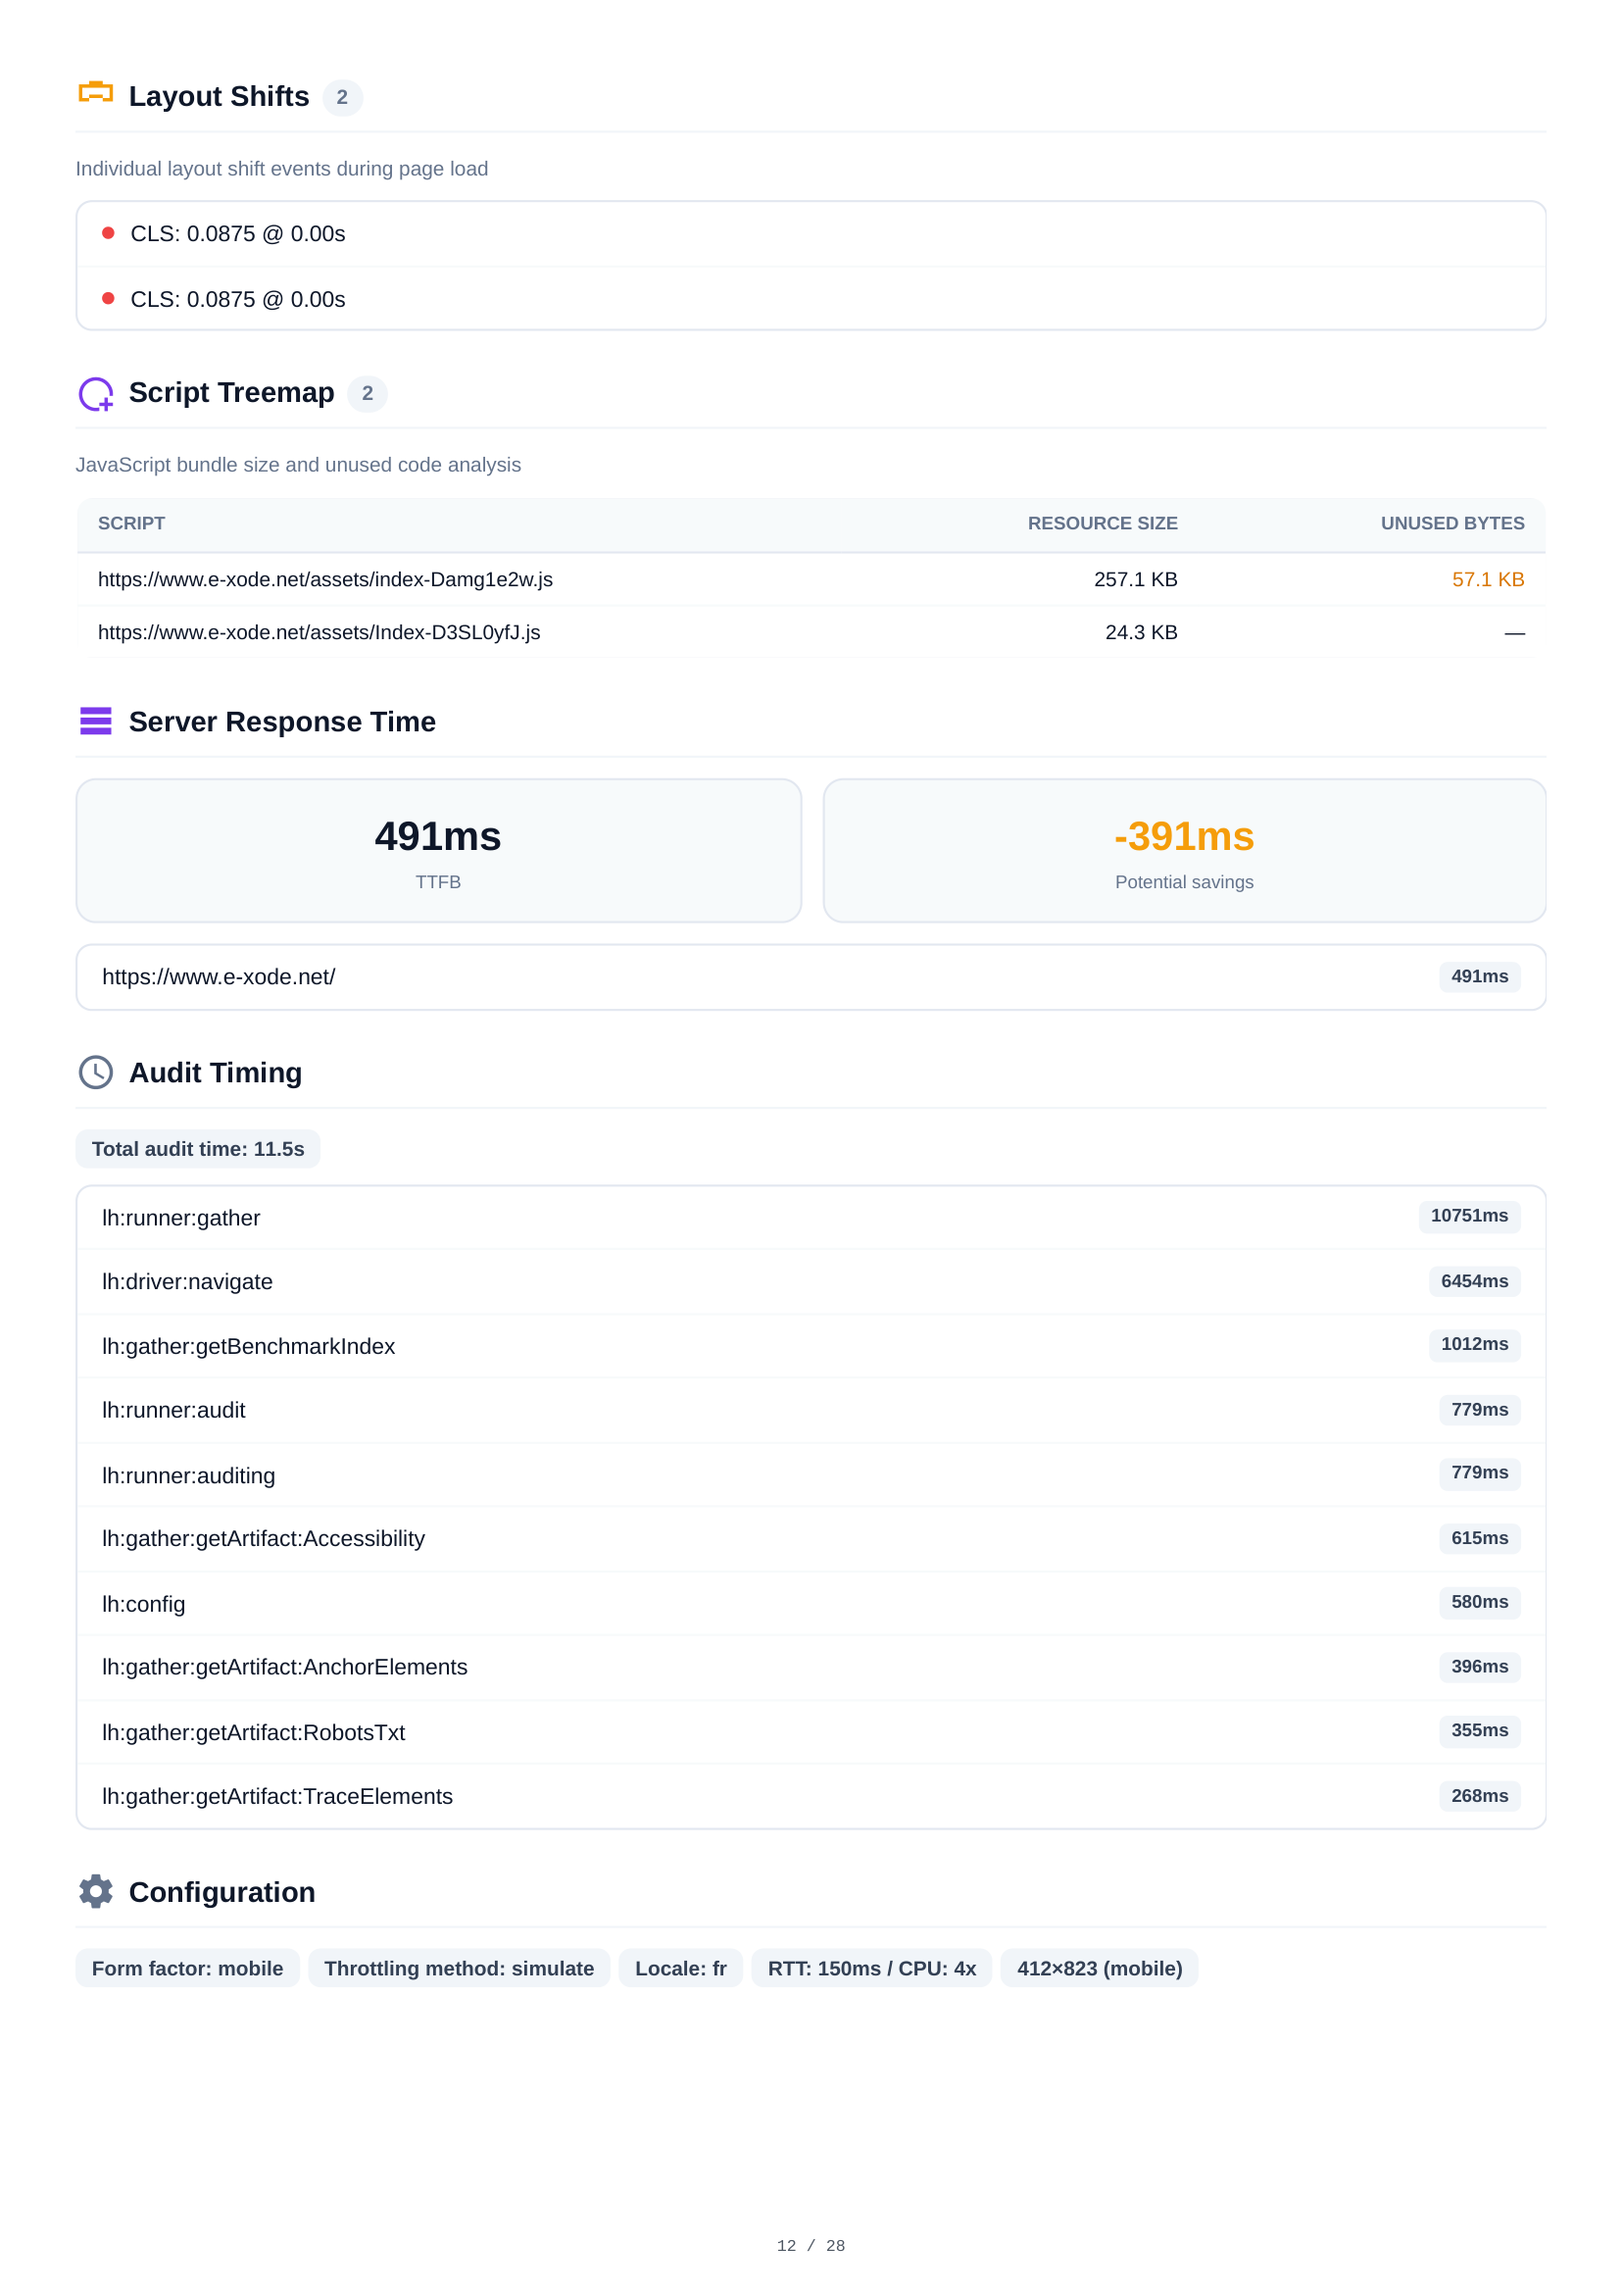

Mobile Layout-Verschiebungen & Script-Analyse
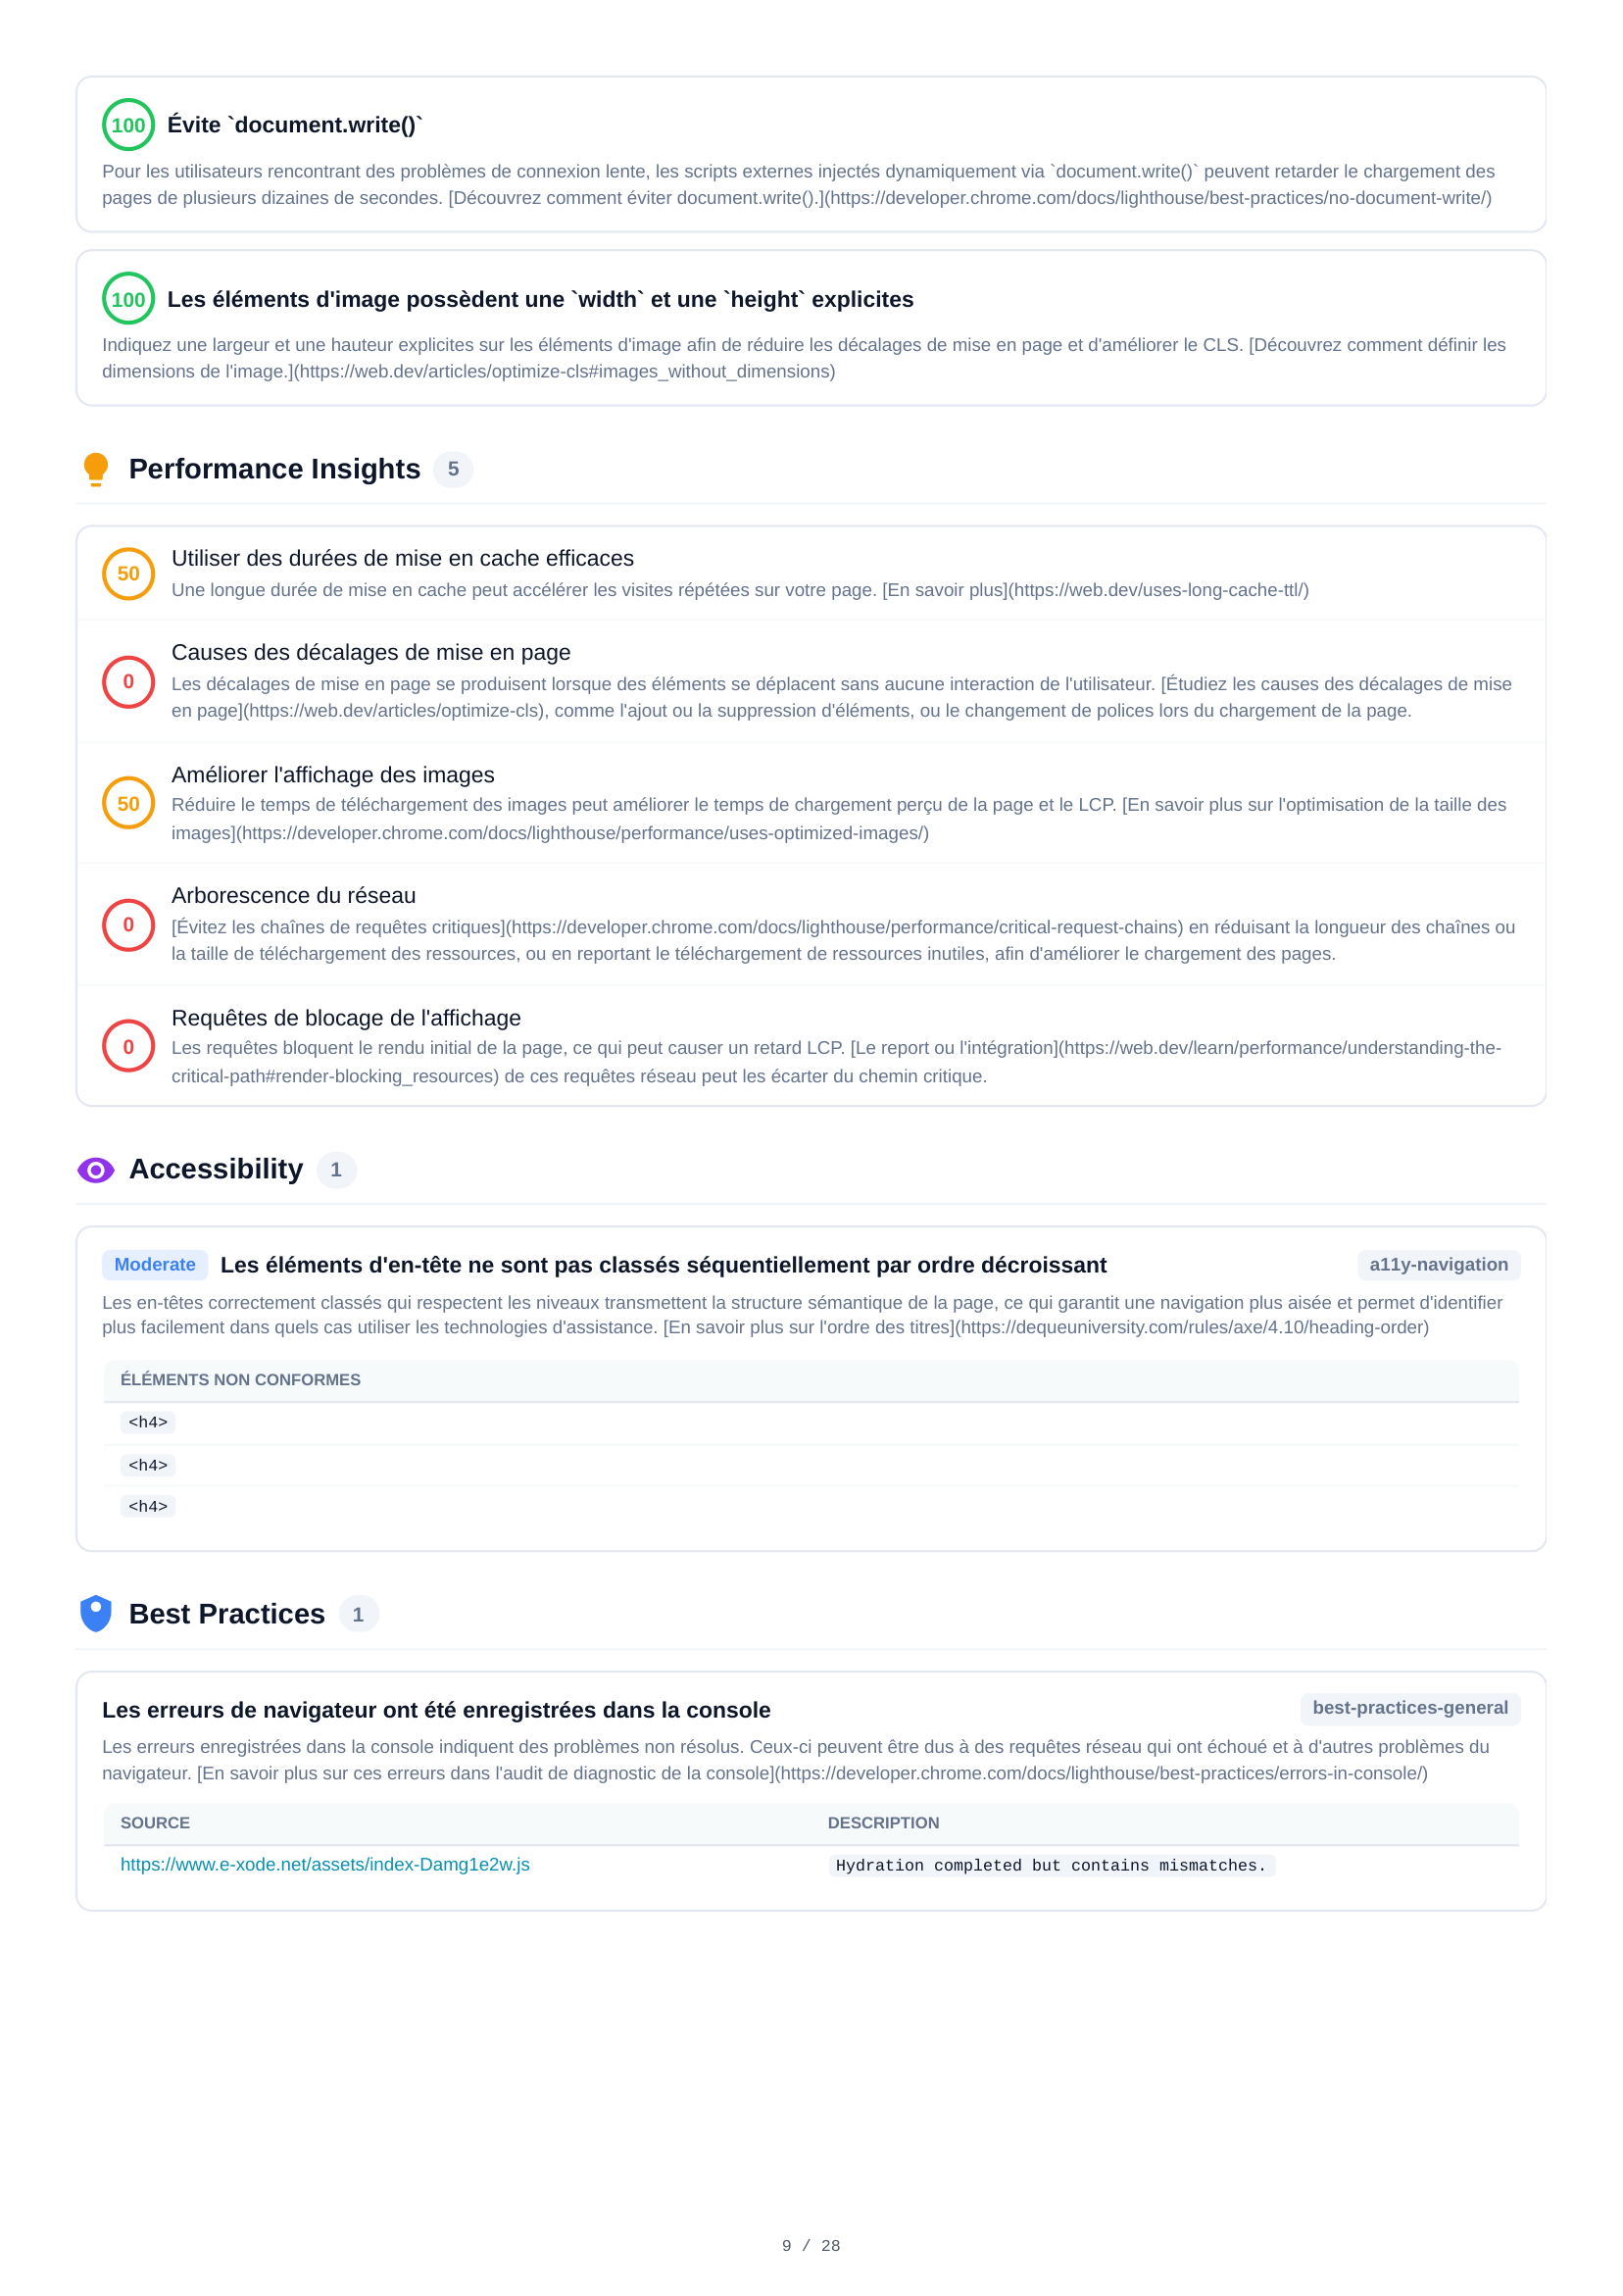
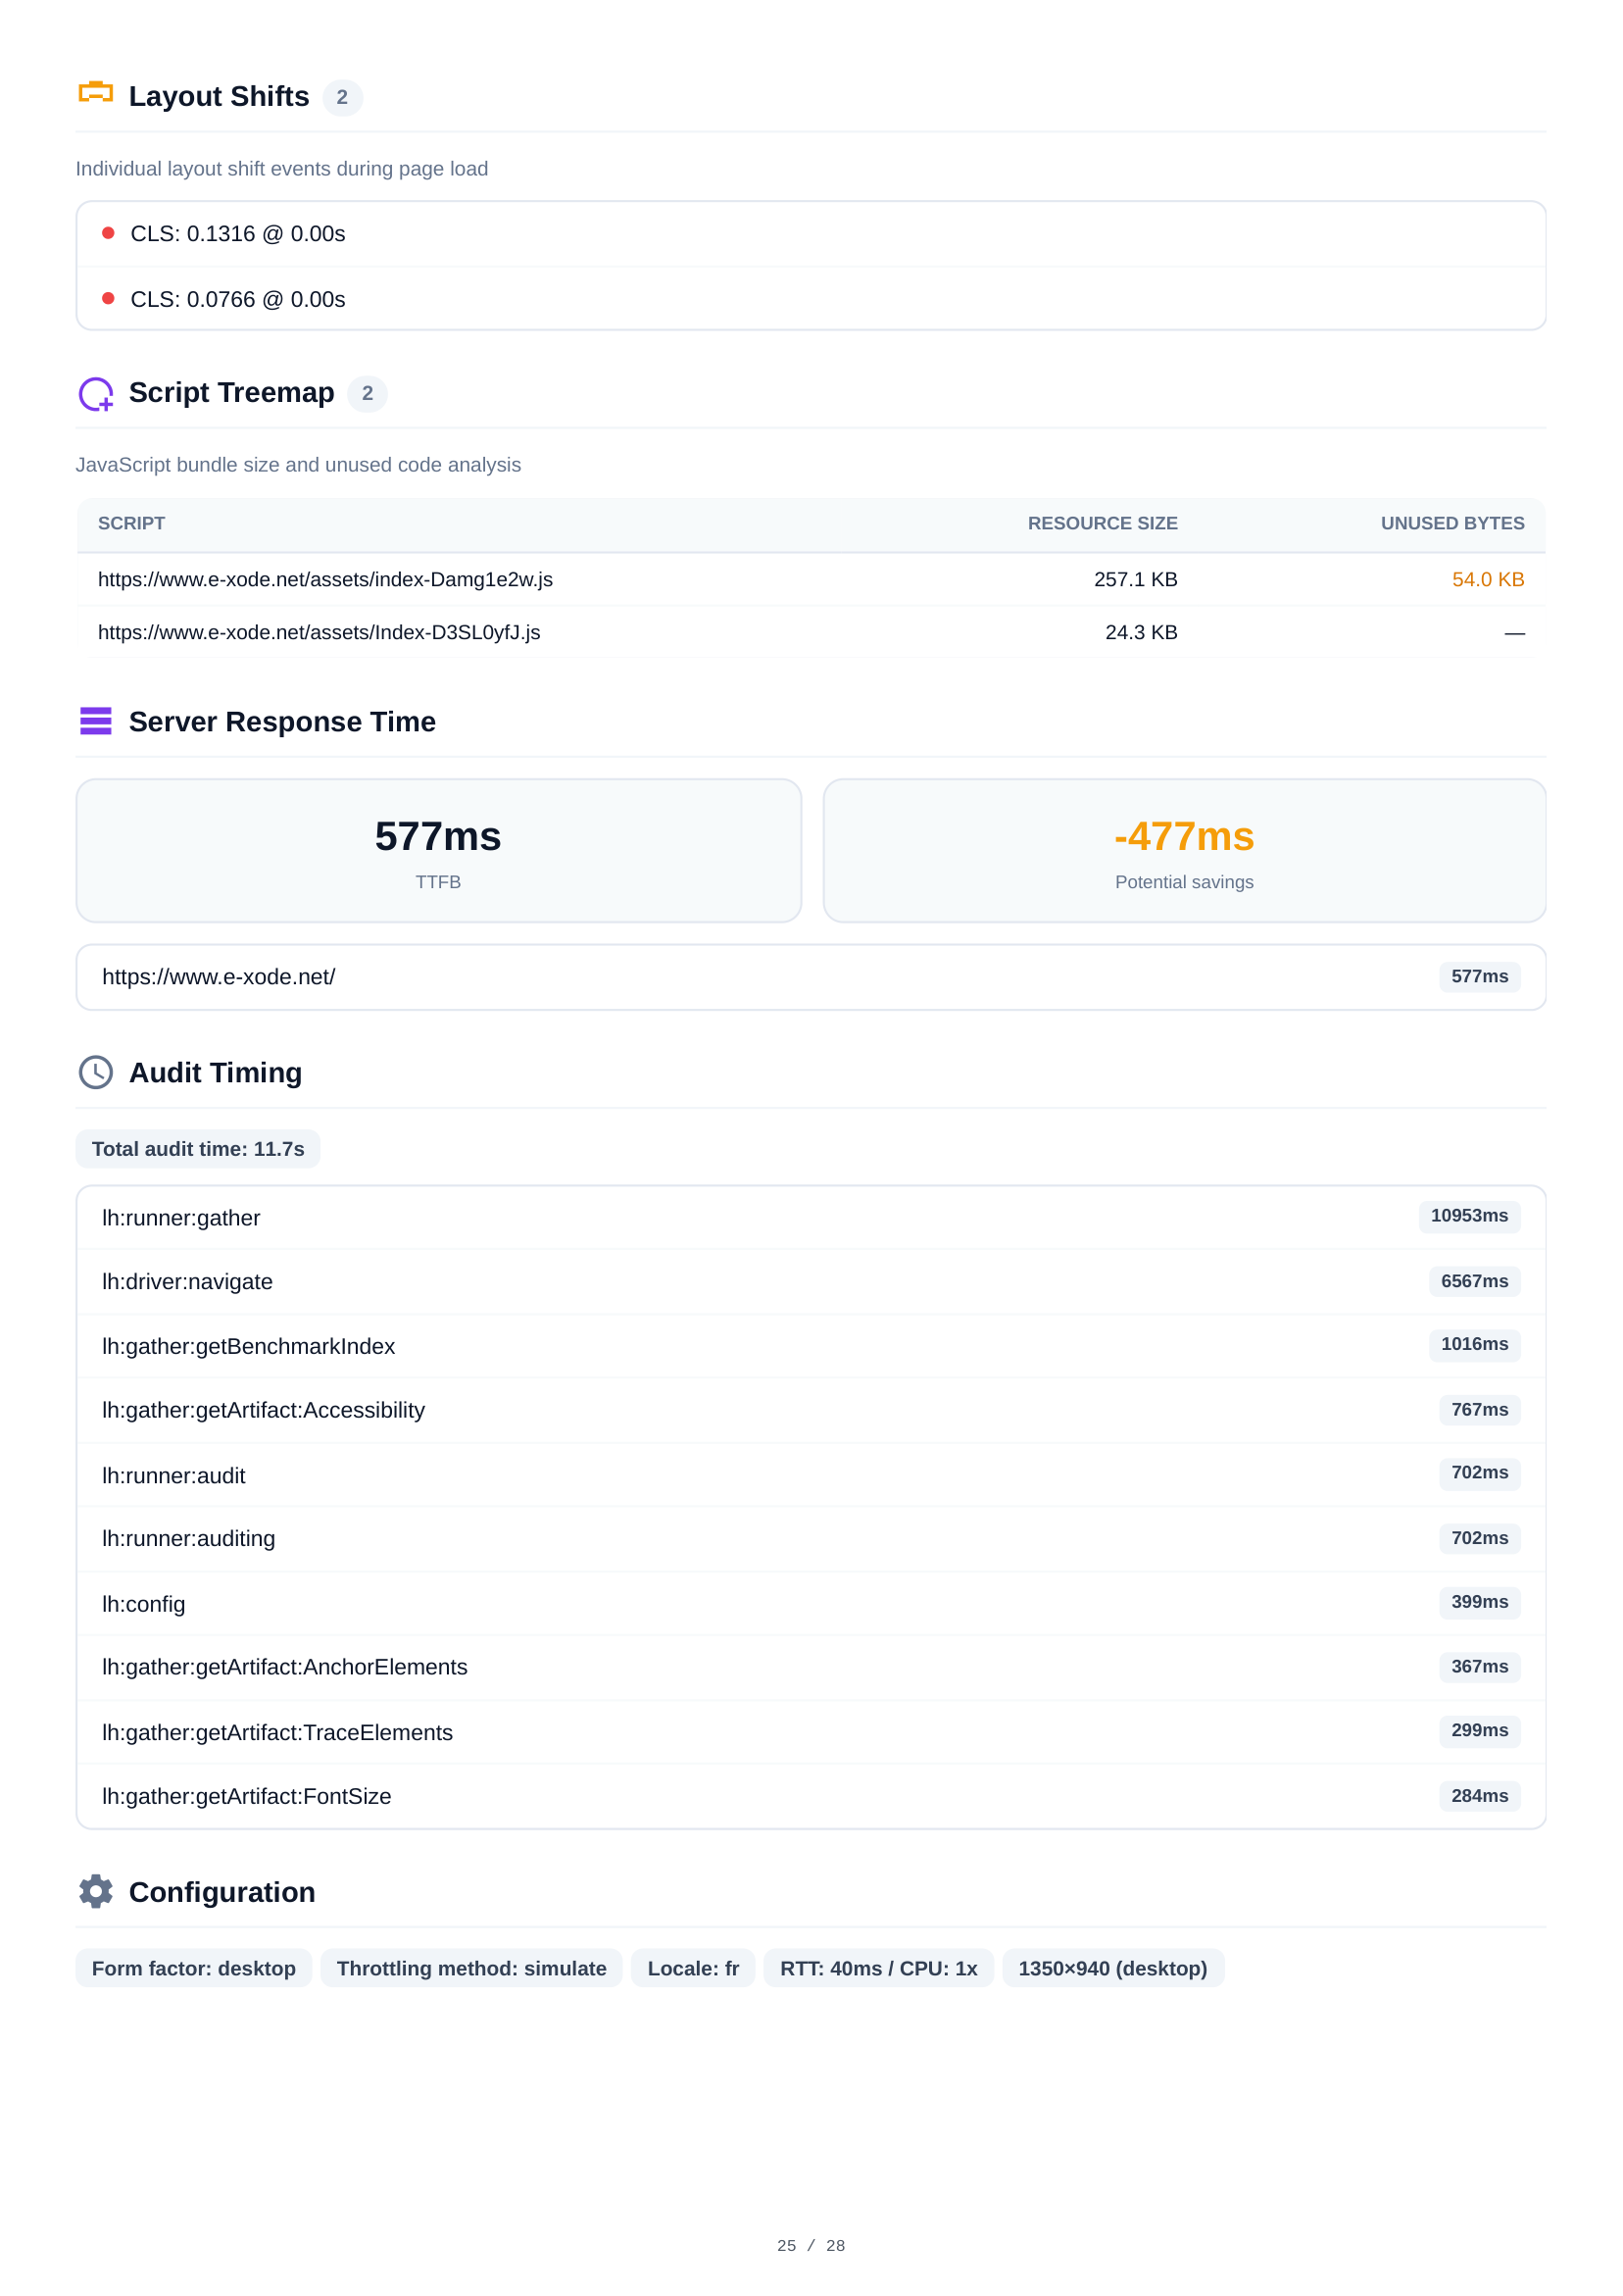
Die Layout-Shift-Analyse zeigt 2 einzelne CLS-Ereignisse beim Seitenaufruf mit genauen Zeitstempeln und Impact-Scores. Die Script-Treemap visualisiert JavaScript-Bundle-Größen und ungenutzten Code, um Optimierungsziele zu identifizieren. Die Konsolenausgabe zeigt 1 Hydration-Mismatch-Warnung.
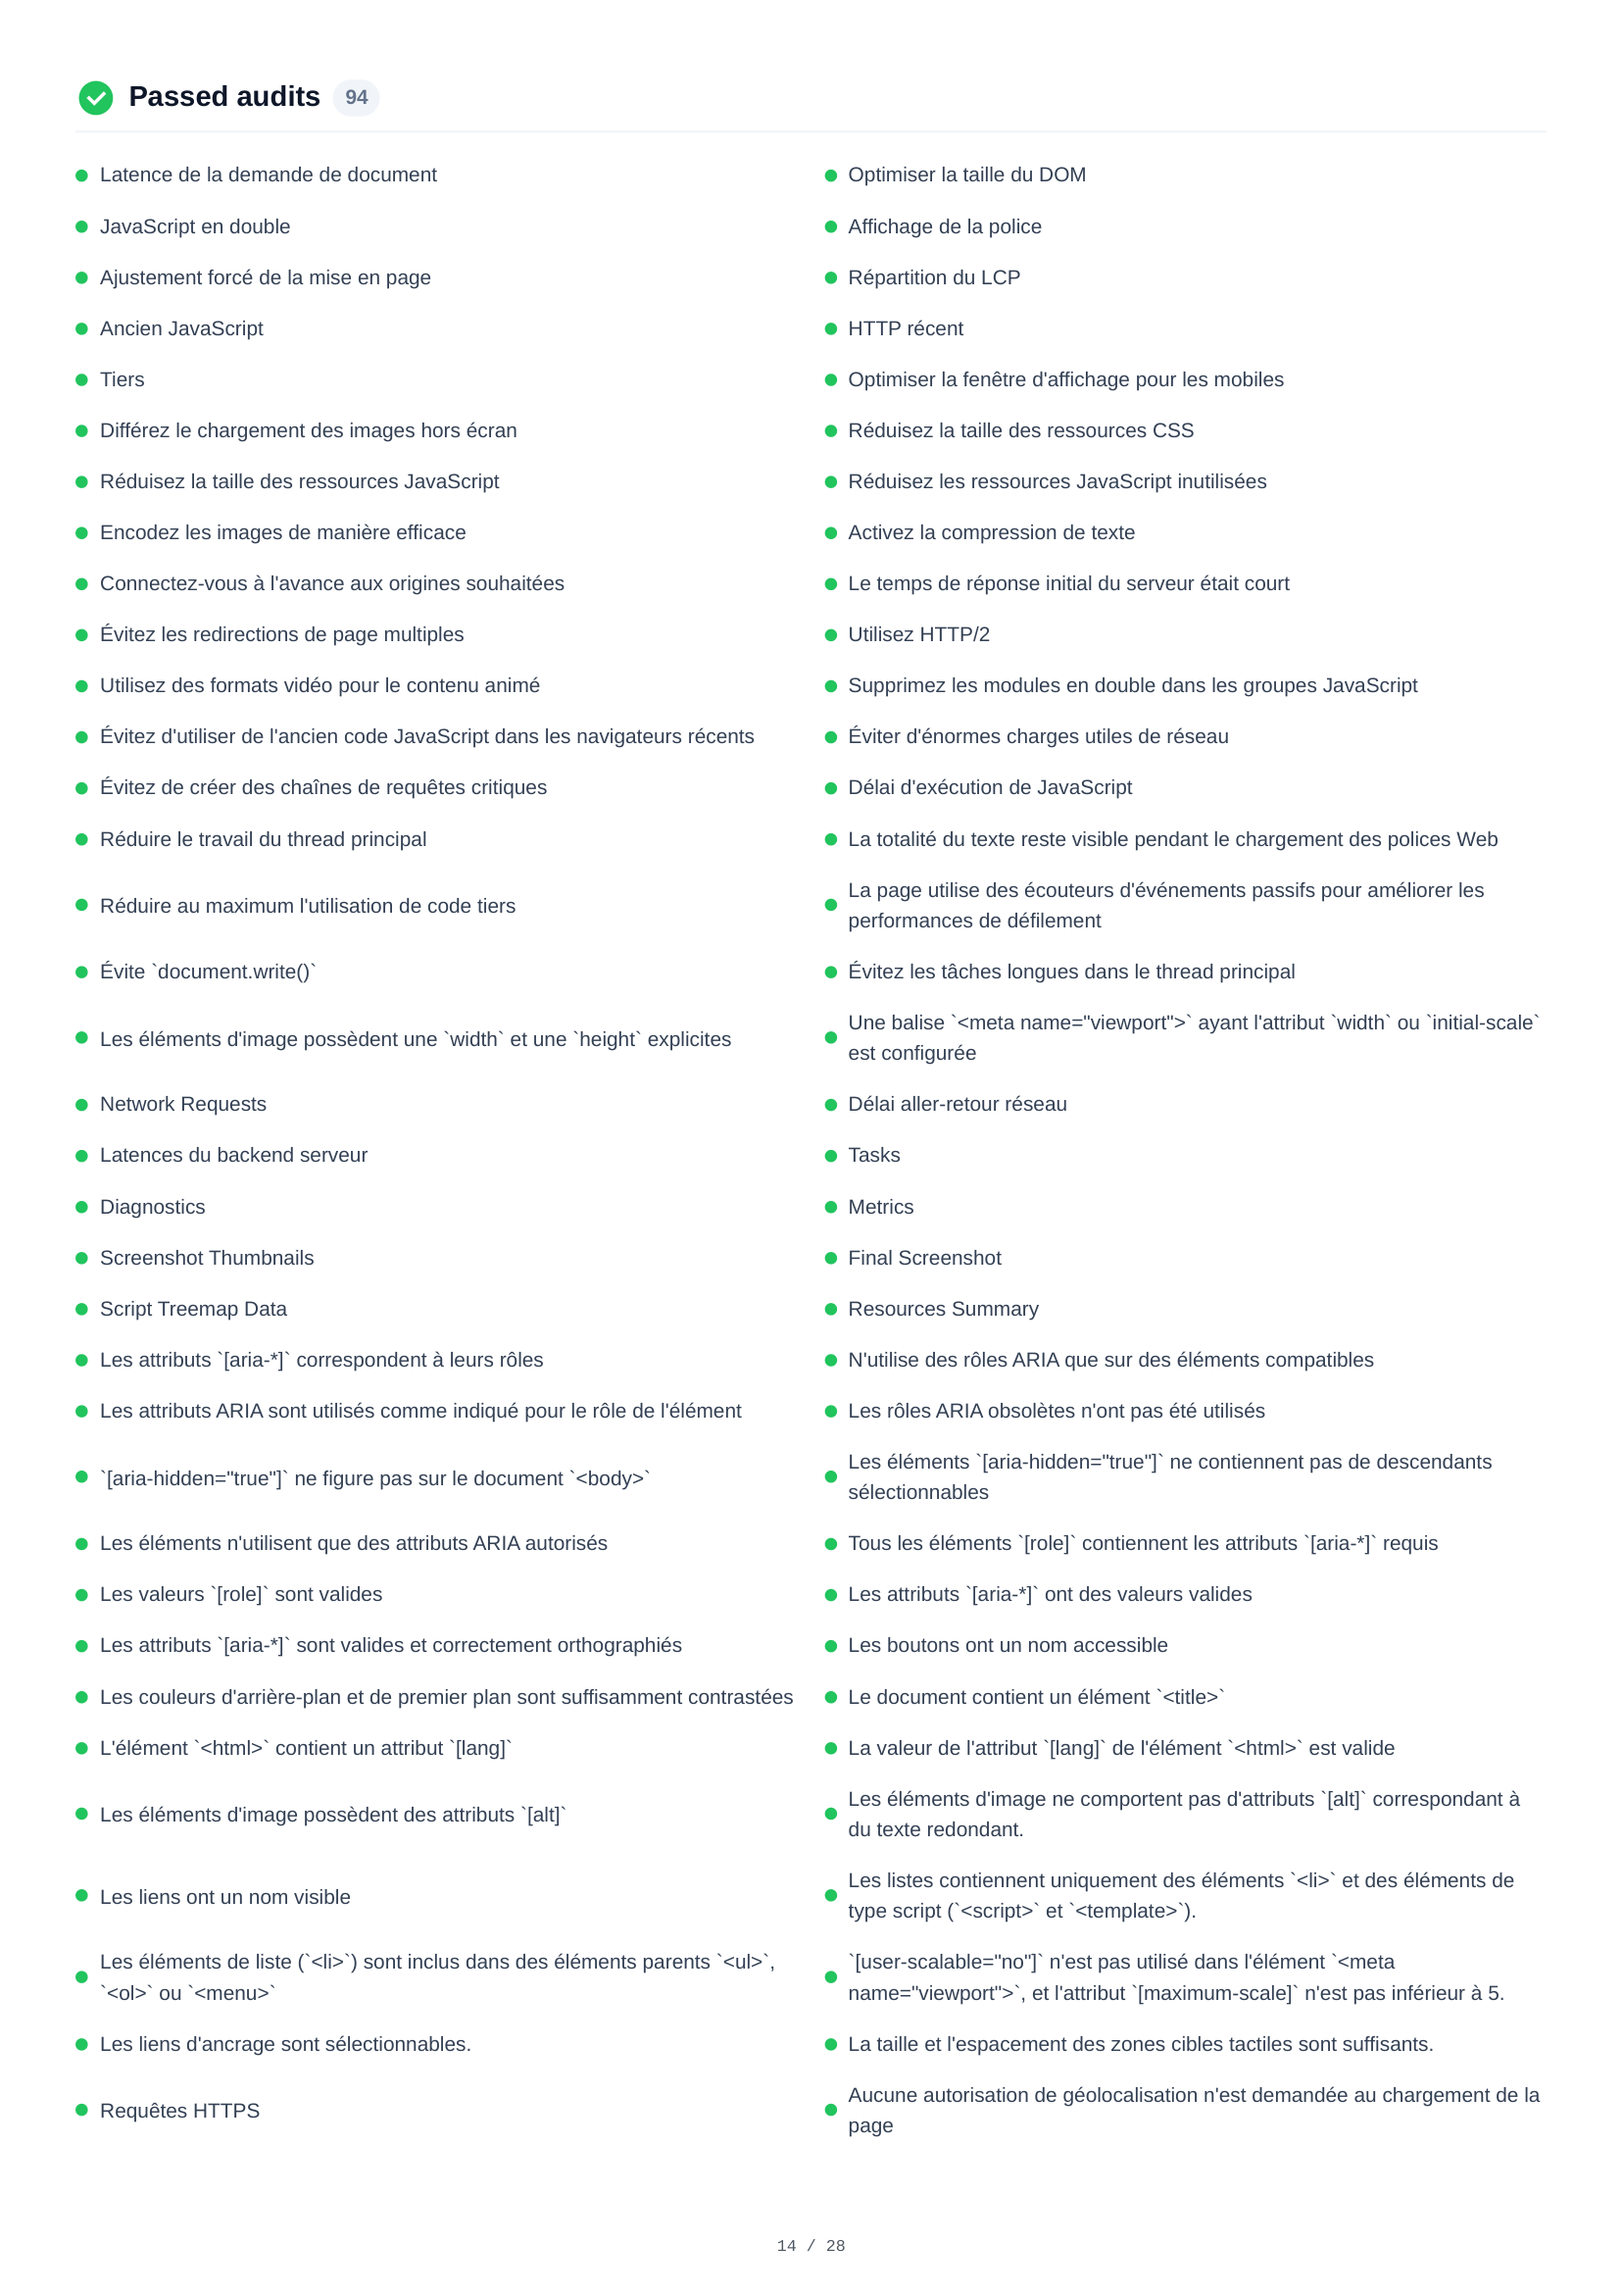
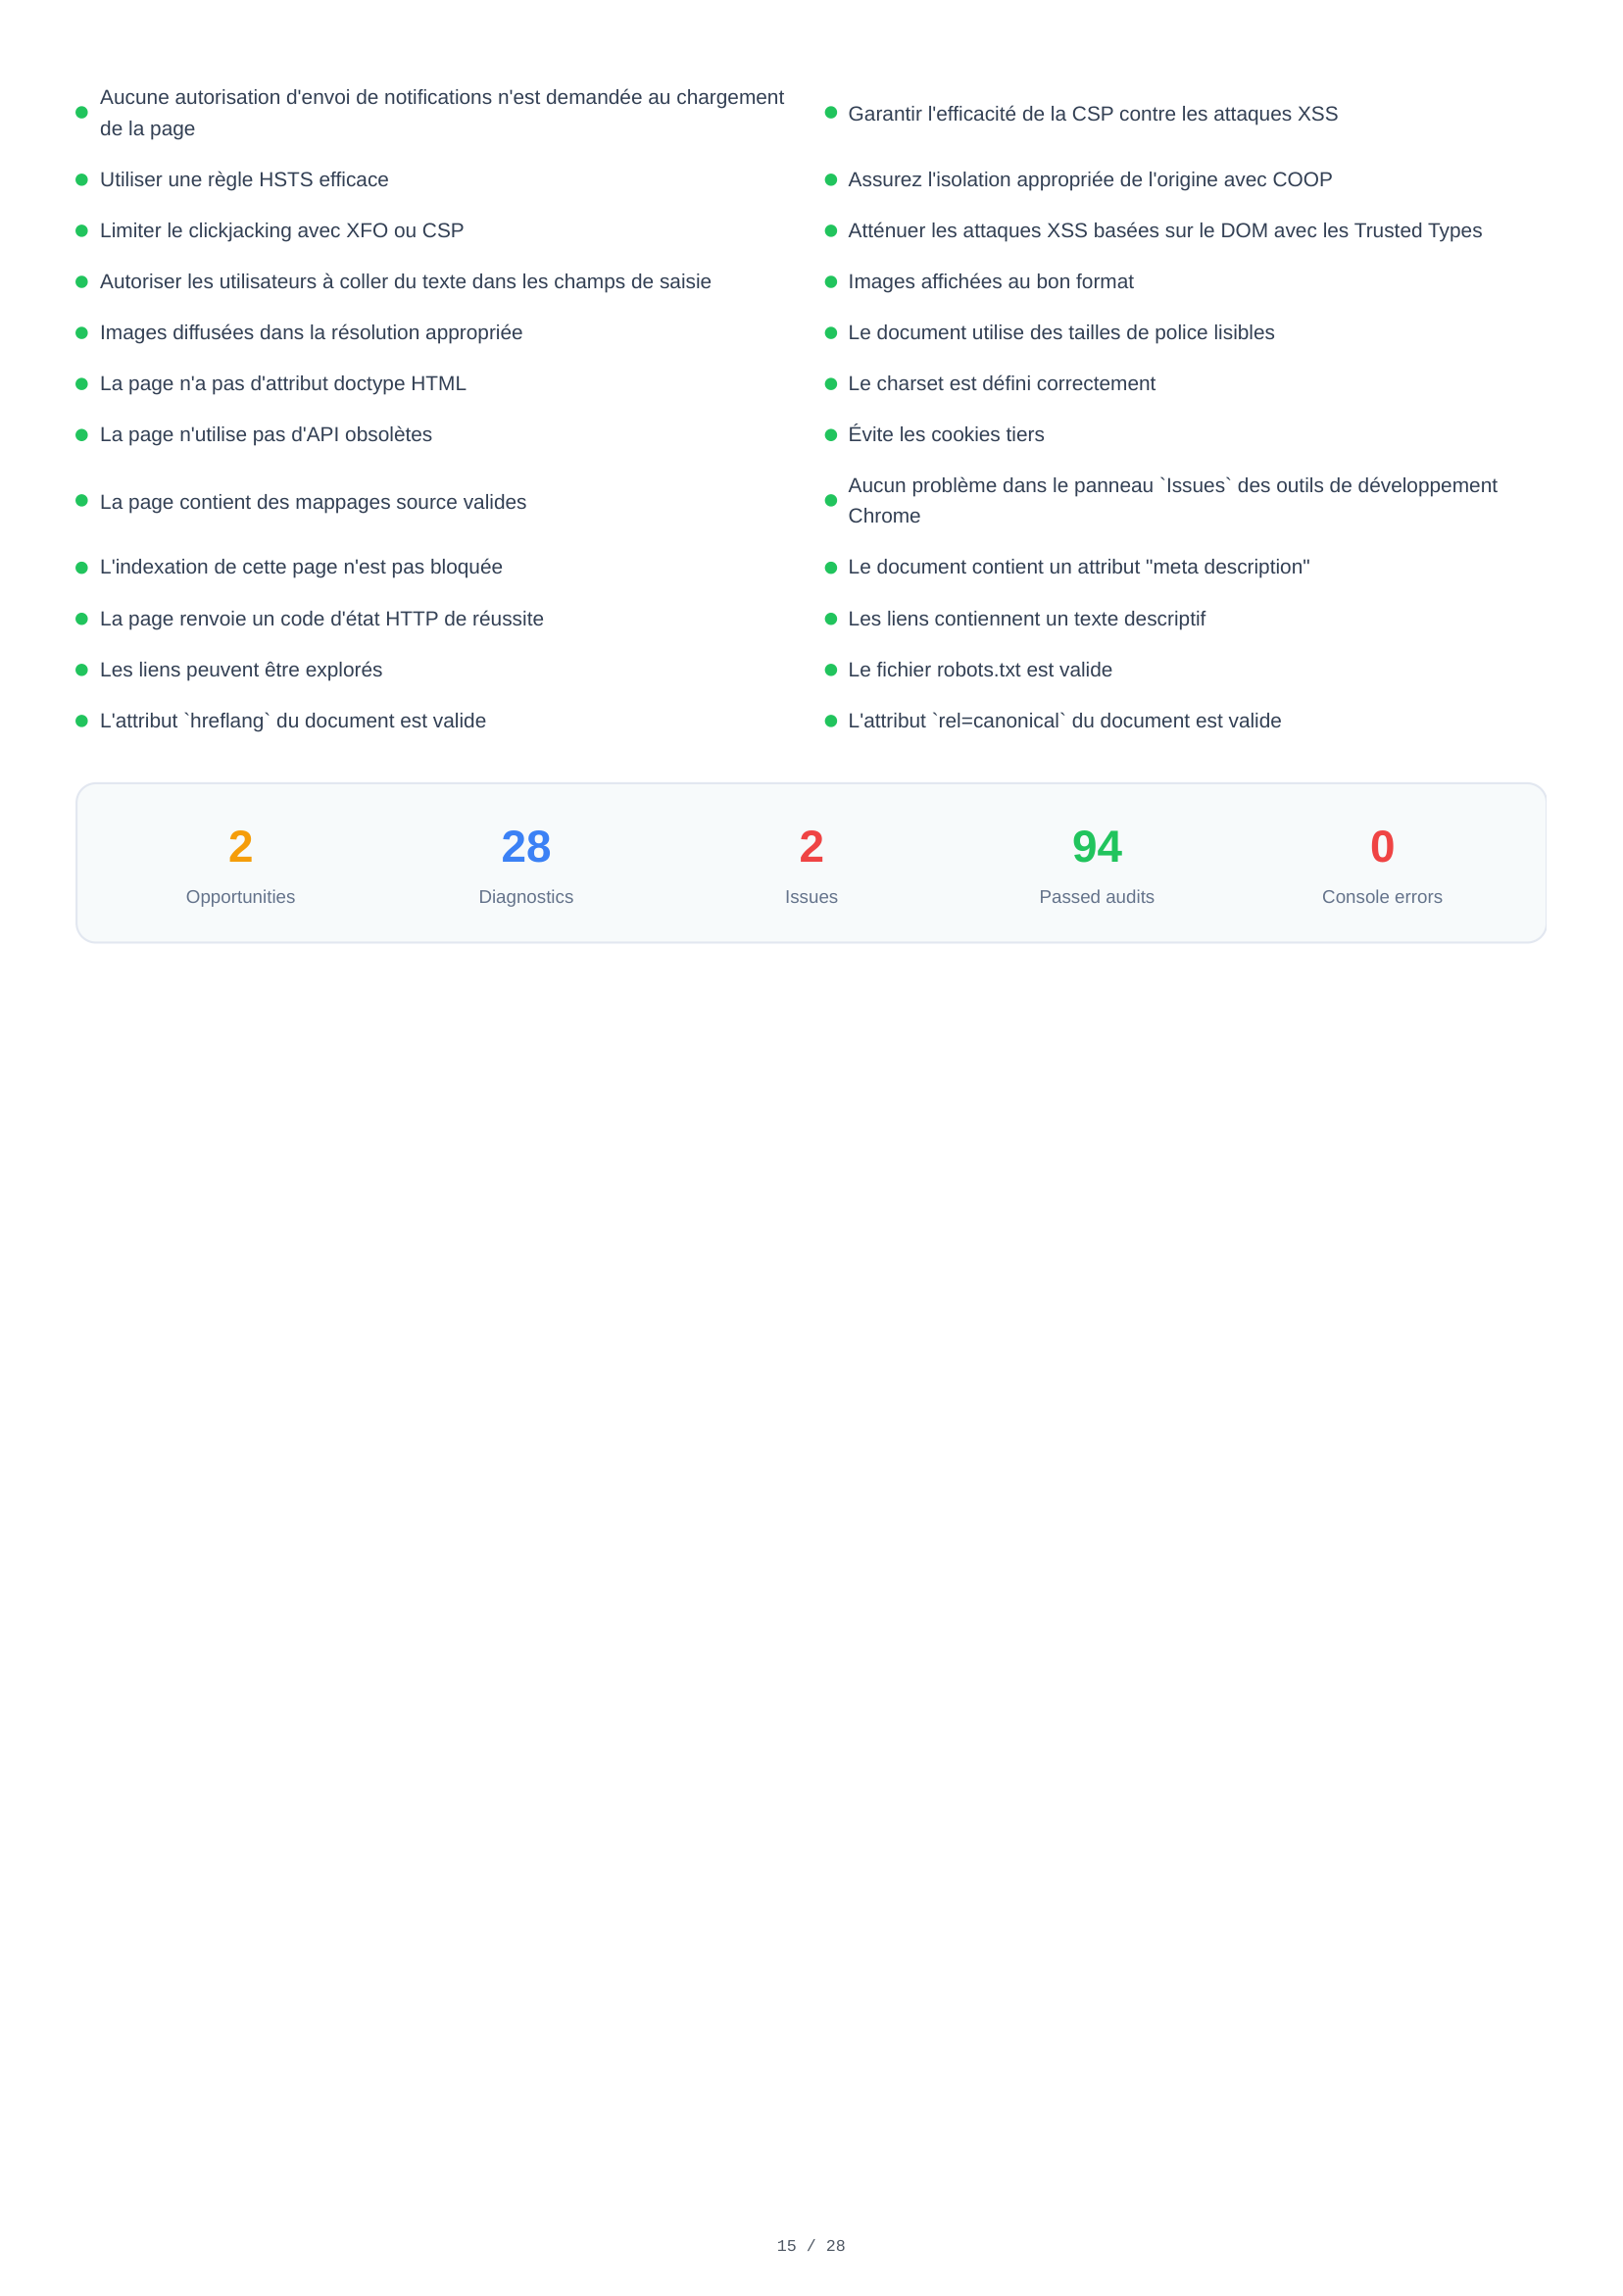
Mobile bestandene Audits
Eine vollständige Liste von 94 bestandenen Audits in allen Kategorien — Performance, Barrierefreiheit, Best Practices und SEO. Dies bestätigt, welche Standards die Seite bereits erfüllt, von korrekten Bildformaten und HTTPS-Nutzung bis hin zu barrierefreien Labels, effizientem Caching und Suchmaschinenoptimierung.
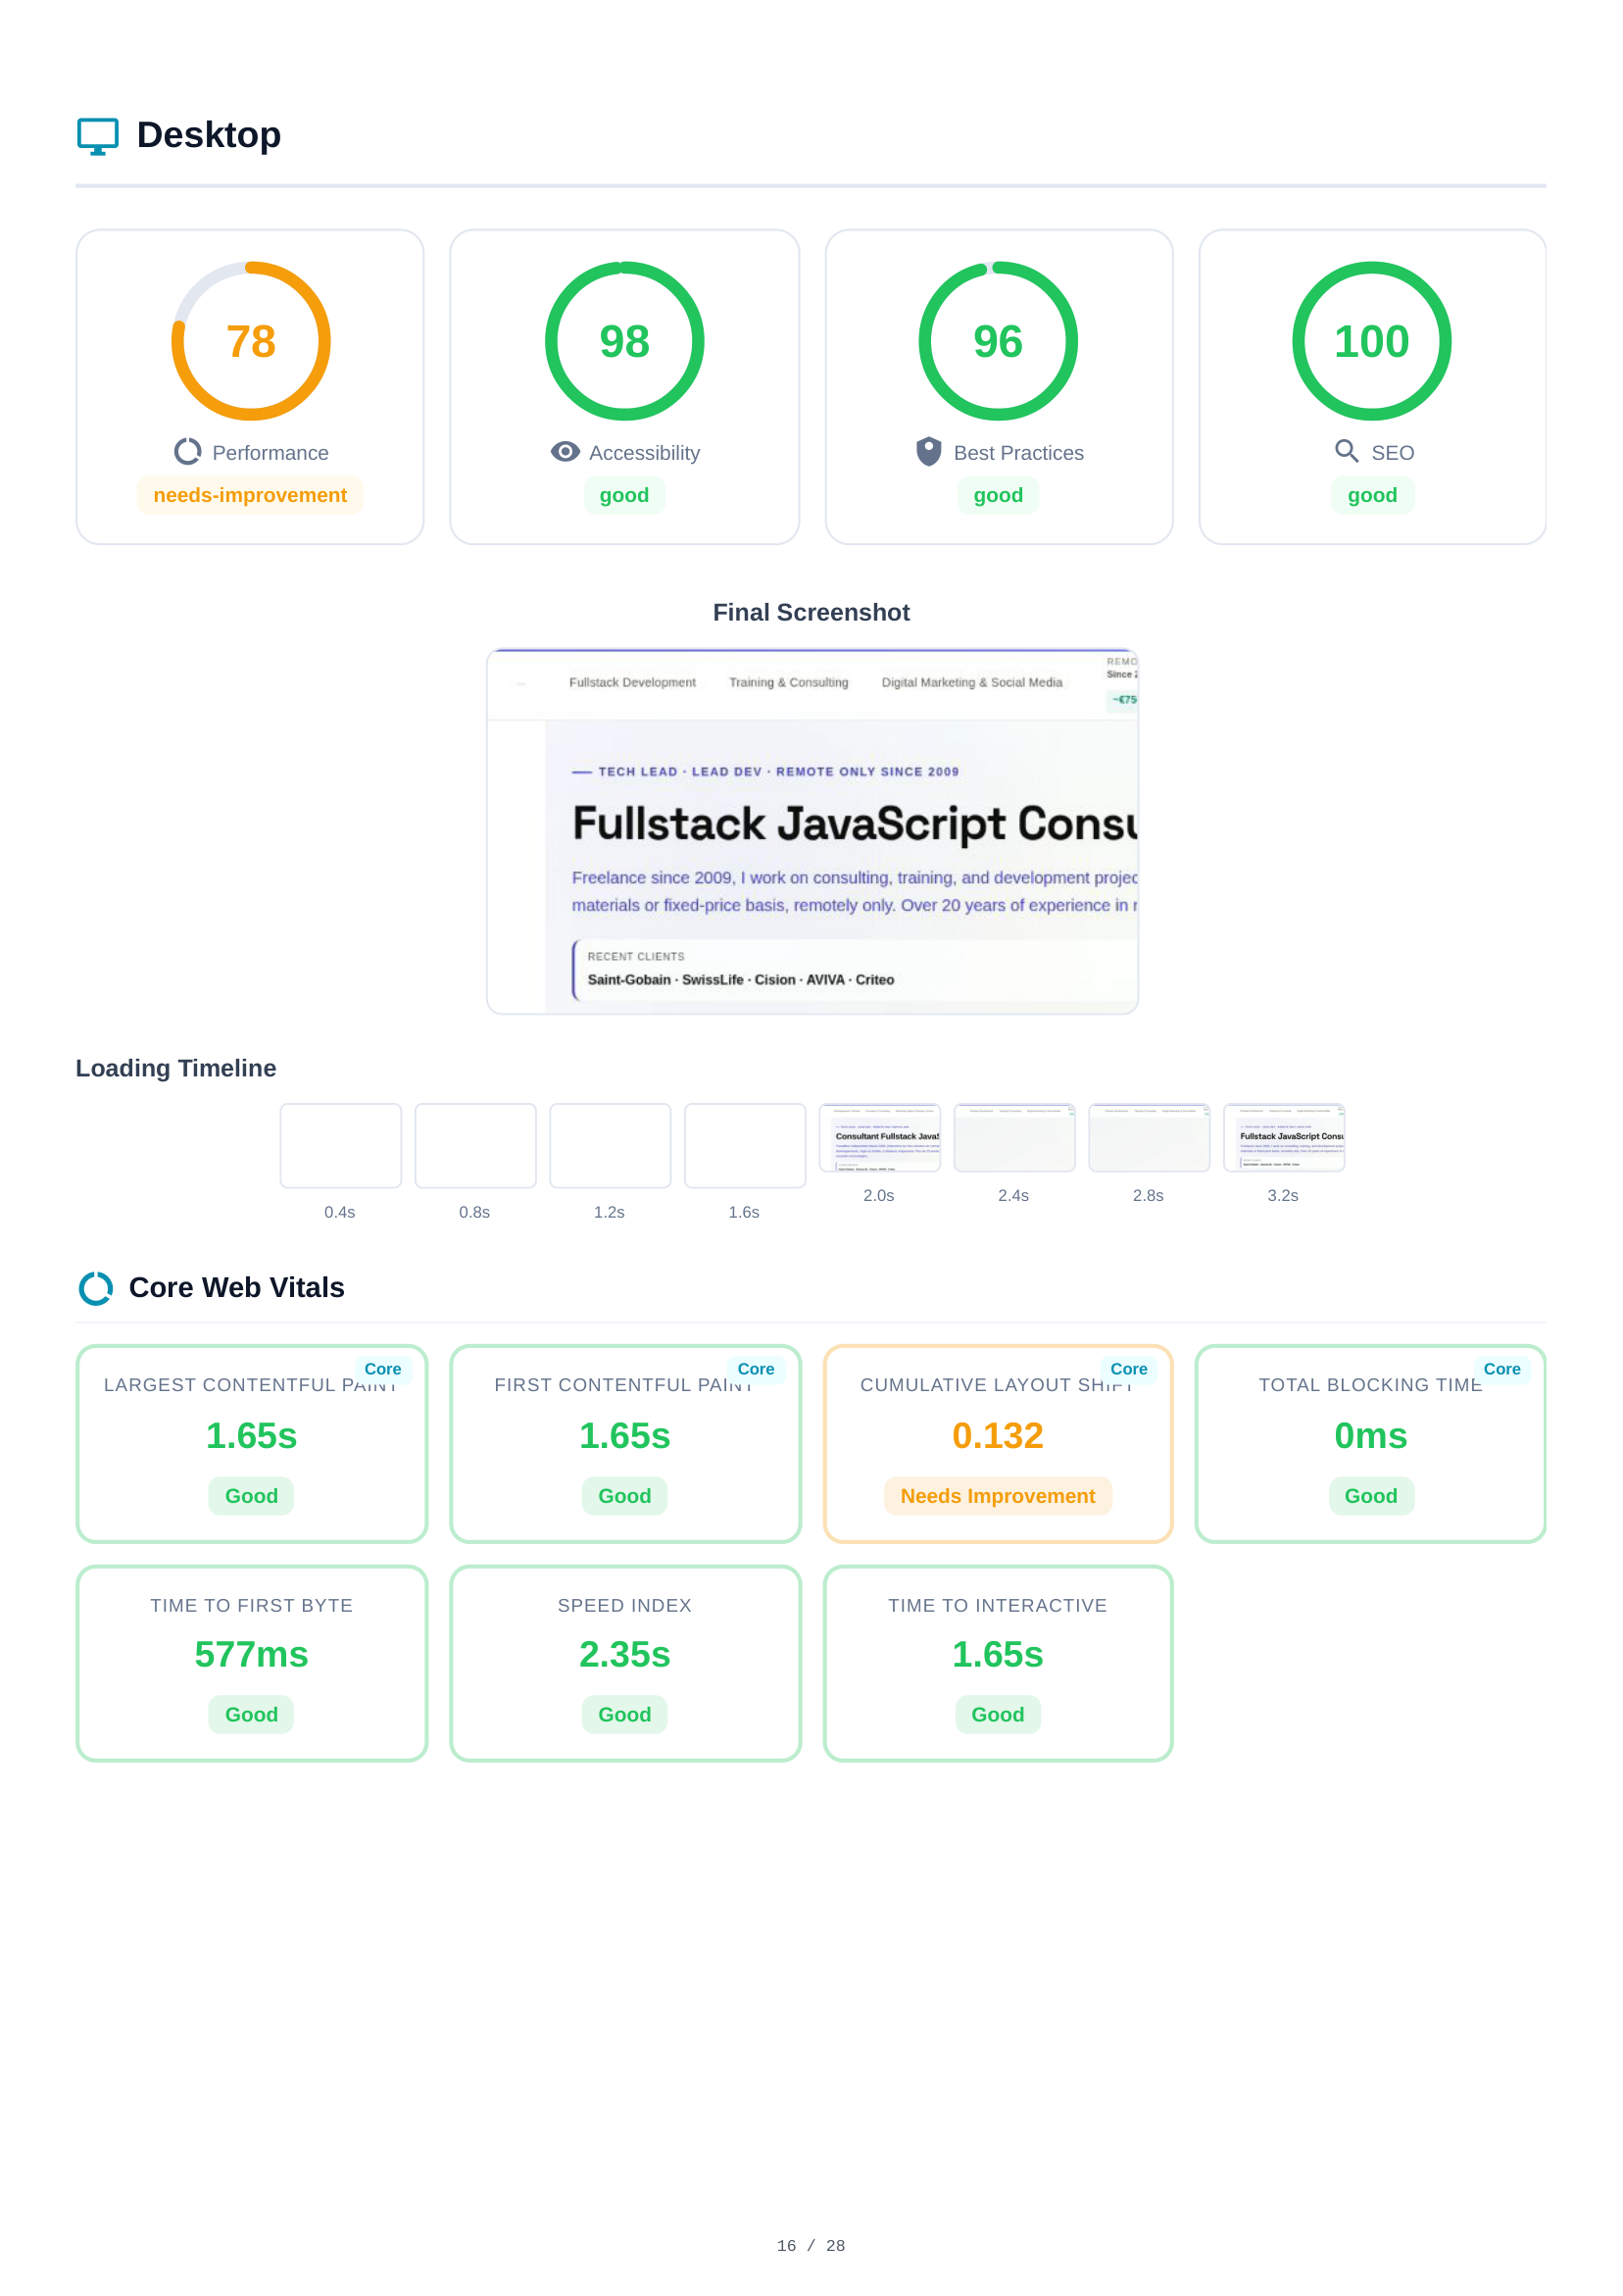
Desktop Scores & Core Web Vitals
Die Desktop-Analyse spiegelt die Mobile-Struktur wider. Scores: Performance (78), Barrierefreiheit (98), Best Practices (96), SEO (100). Die Lade-Zeitachse und der abschließende Screenshot zeigen das Desktop-Rendering-Verhalten. Core Web Vitals werden unabhängig gemessen und zeigen aufgrund von Viewport- und Netzwerkbedingungen oft unterschiedliche Werte.
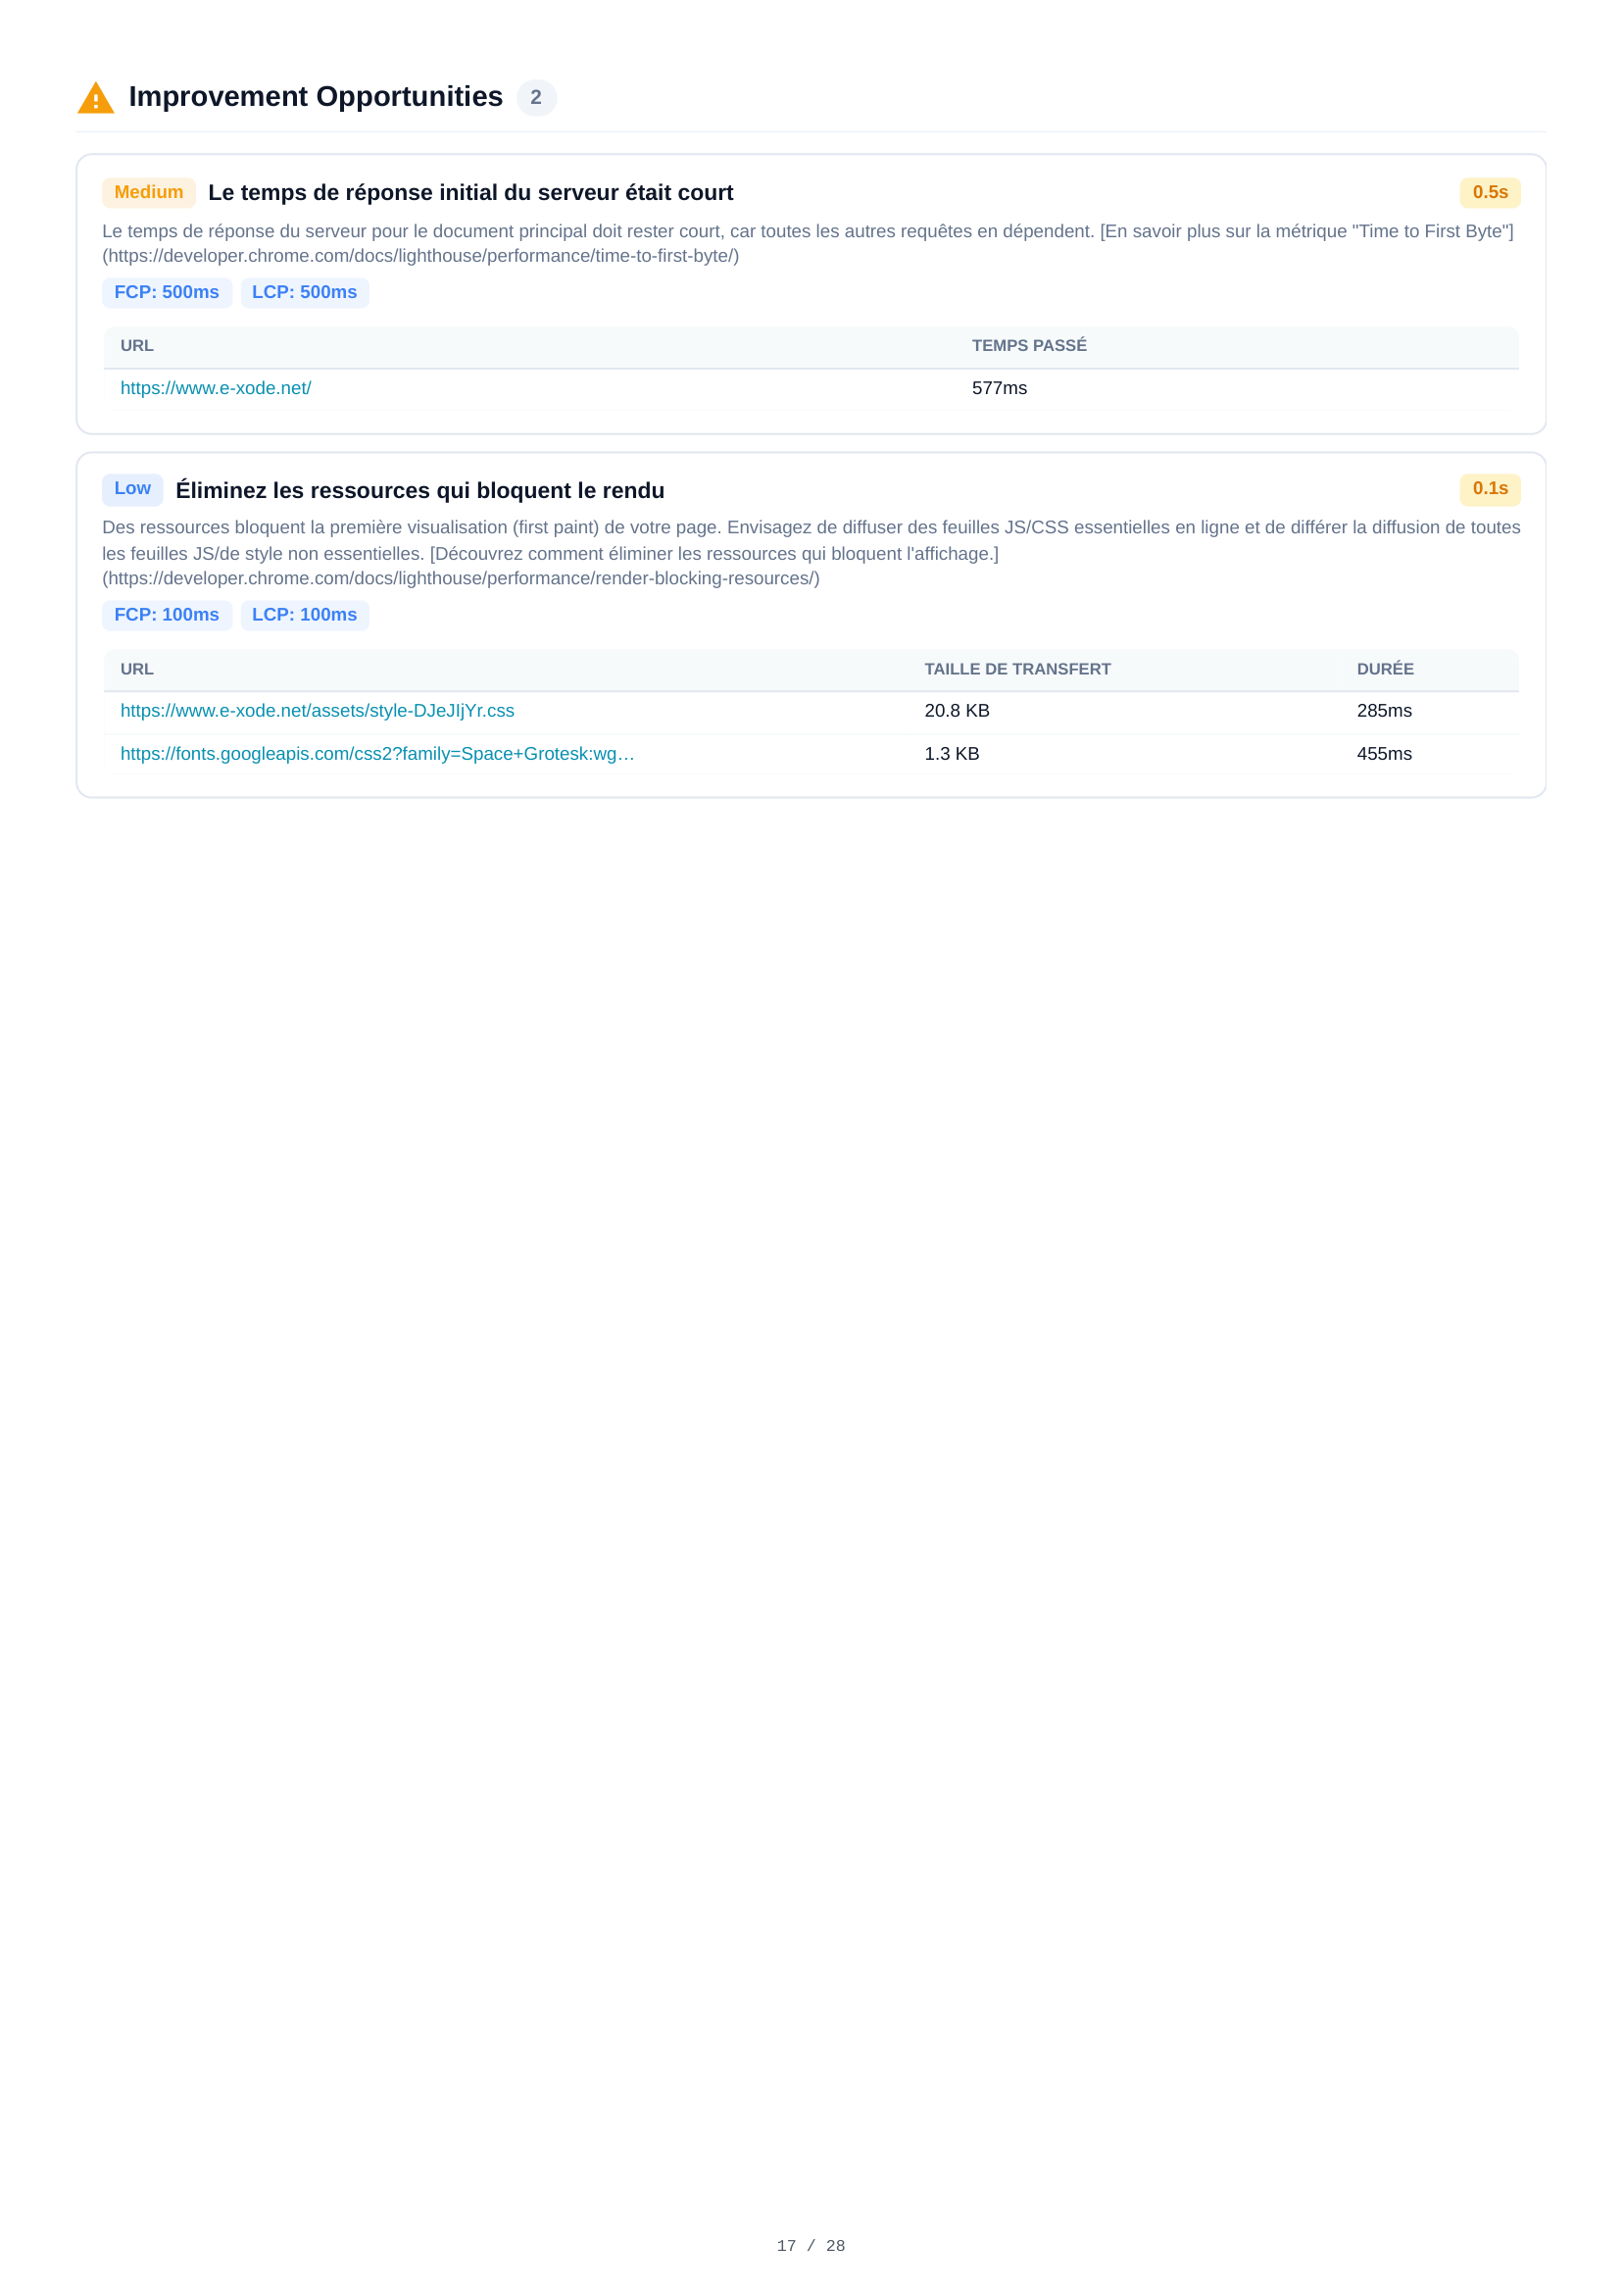
Desktop Optimierungsmöglichkeiten
Zwei Optimierungsmöglichkeiten für Desktop, darunter Server-Antwortzeit (0,5 s) und Optimierungen der Ressourcenbereitstellung. Obwohl ähnlich wie die Mobile-Erkenntnisse, unterscheiden sich geschätzte Einsparungen und Schwellenwerte aufgrund der schnelleren Desktop-Baseline.
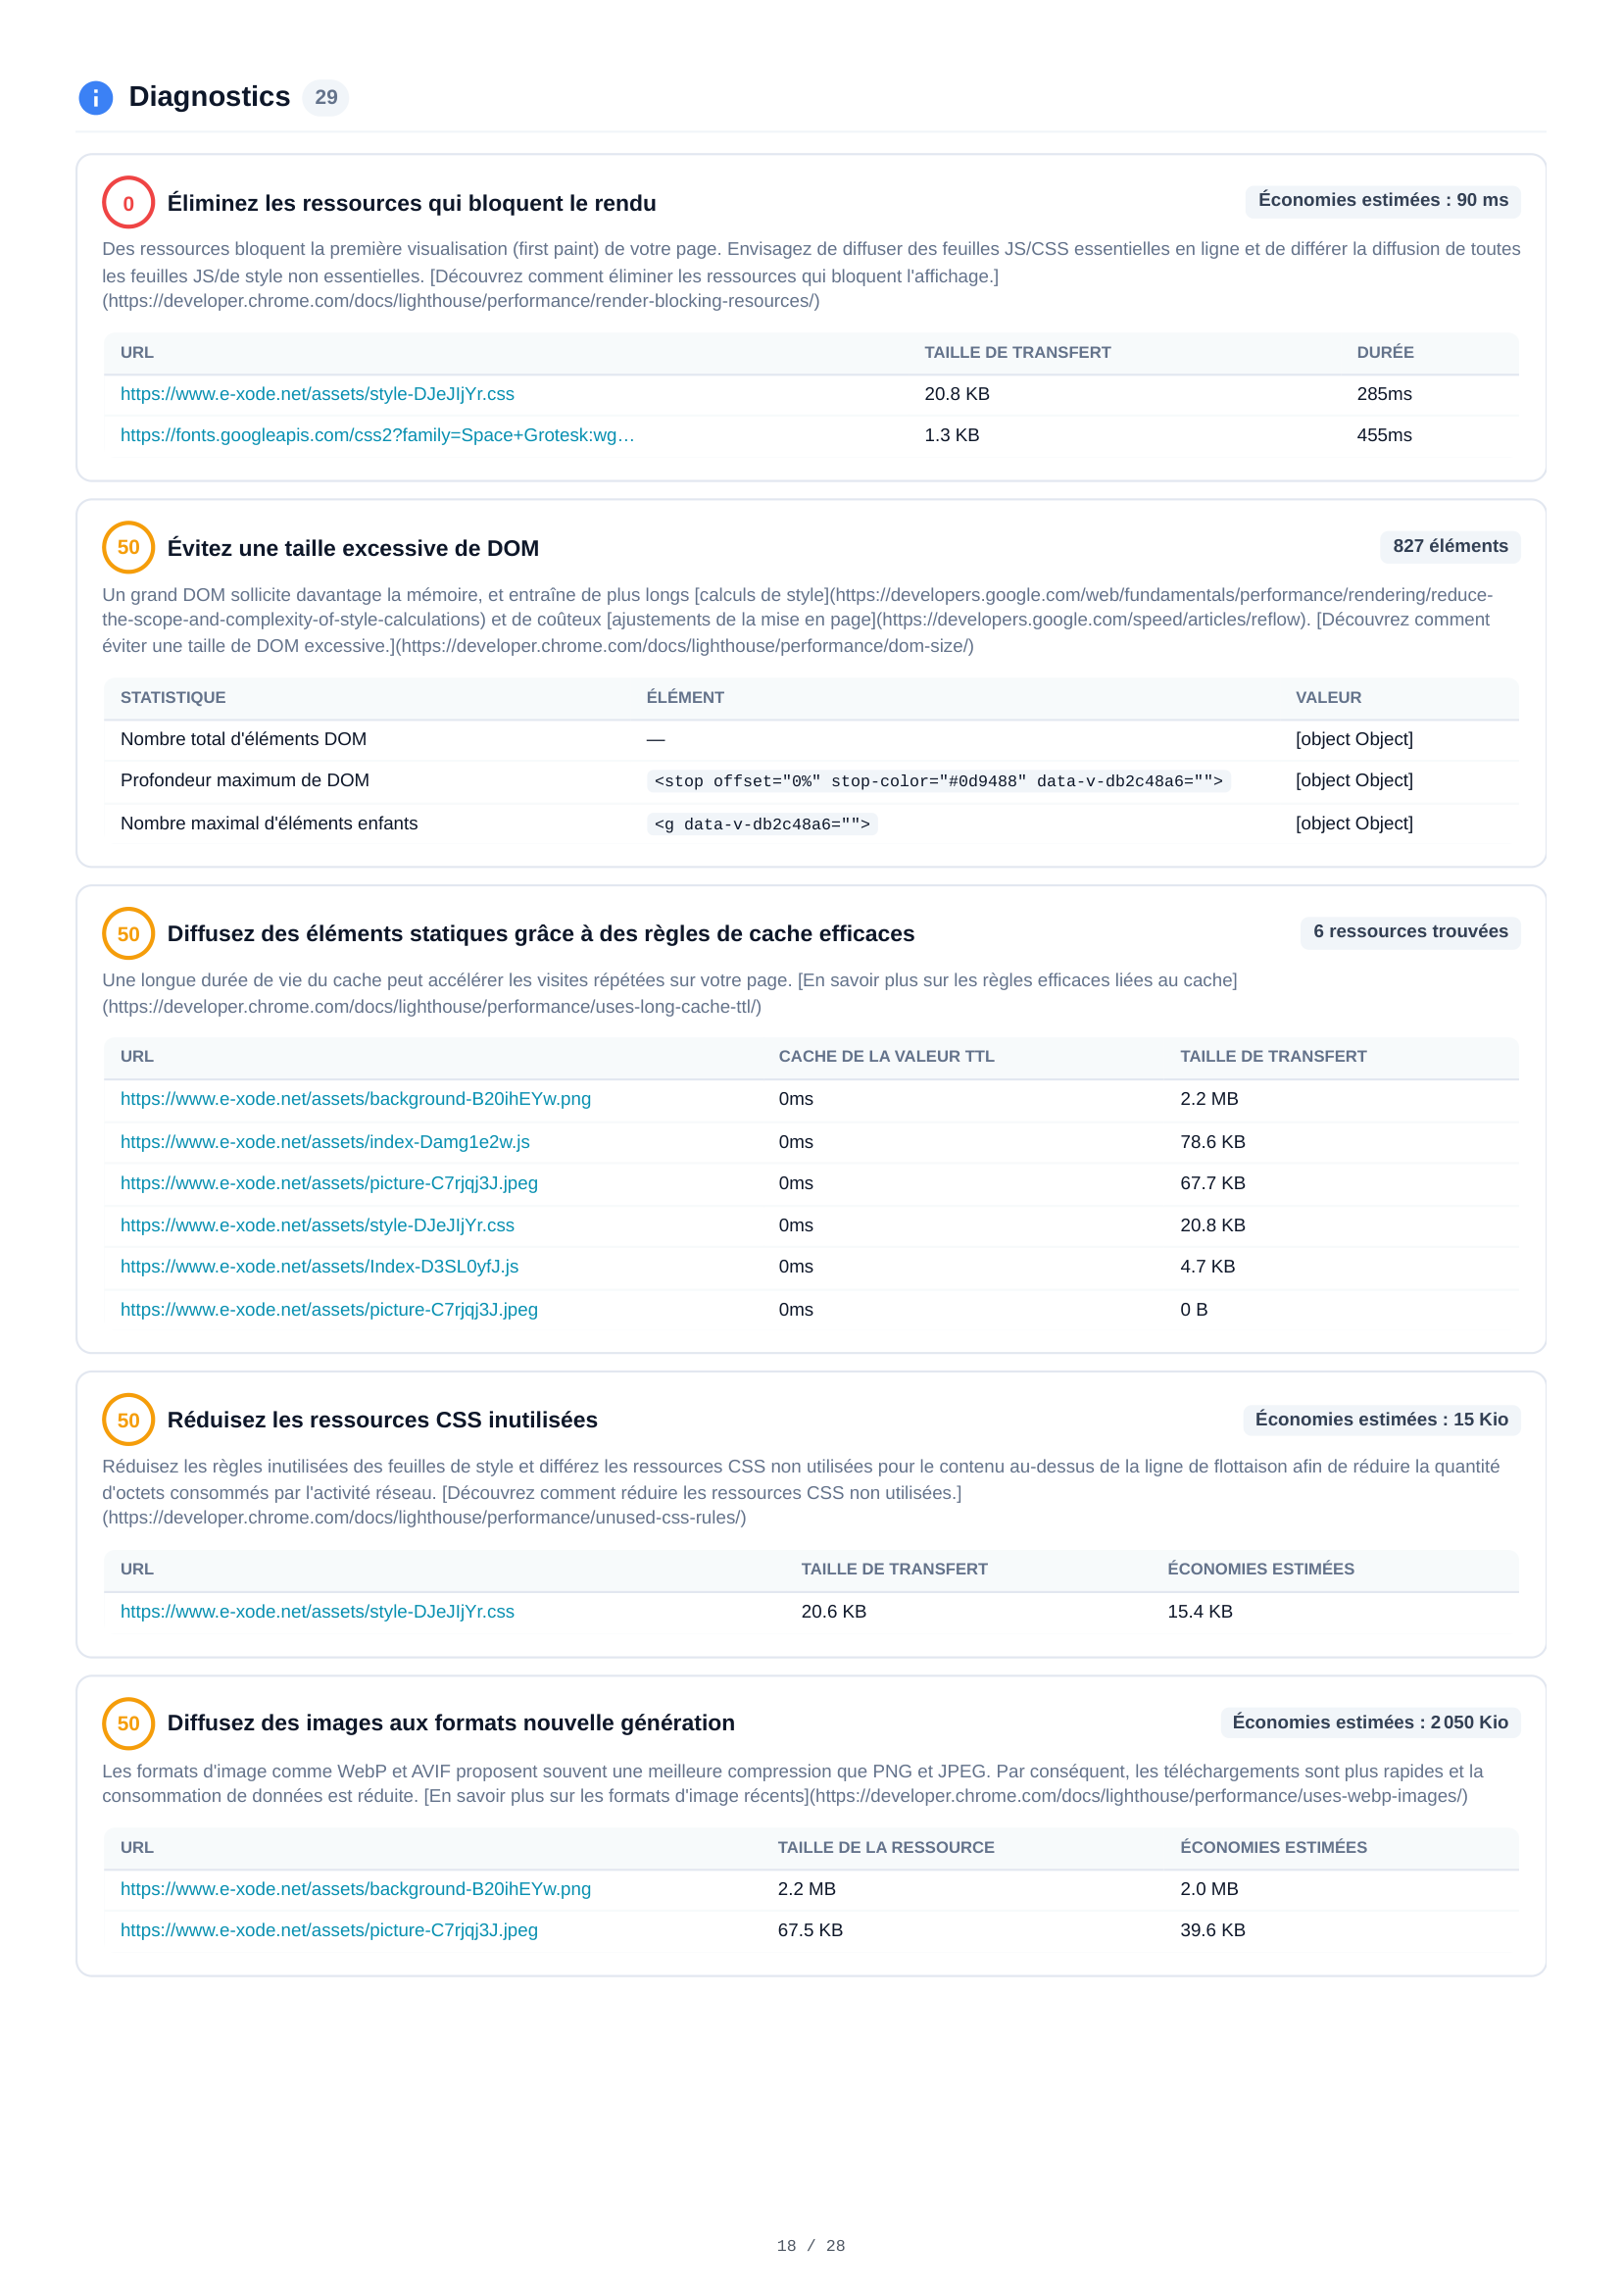
Desktop Diagnosen
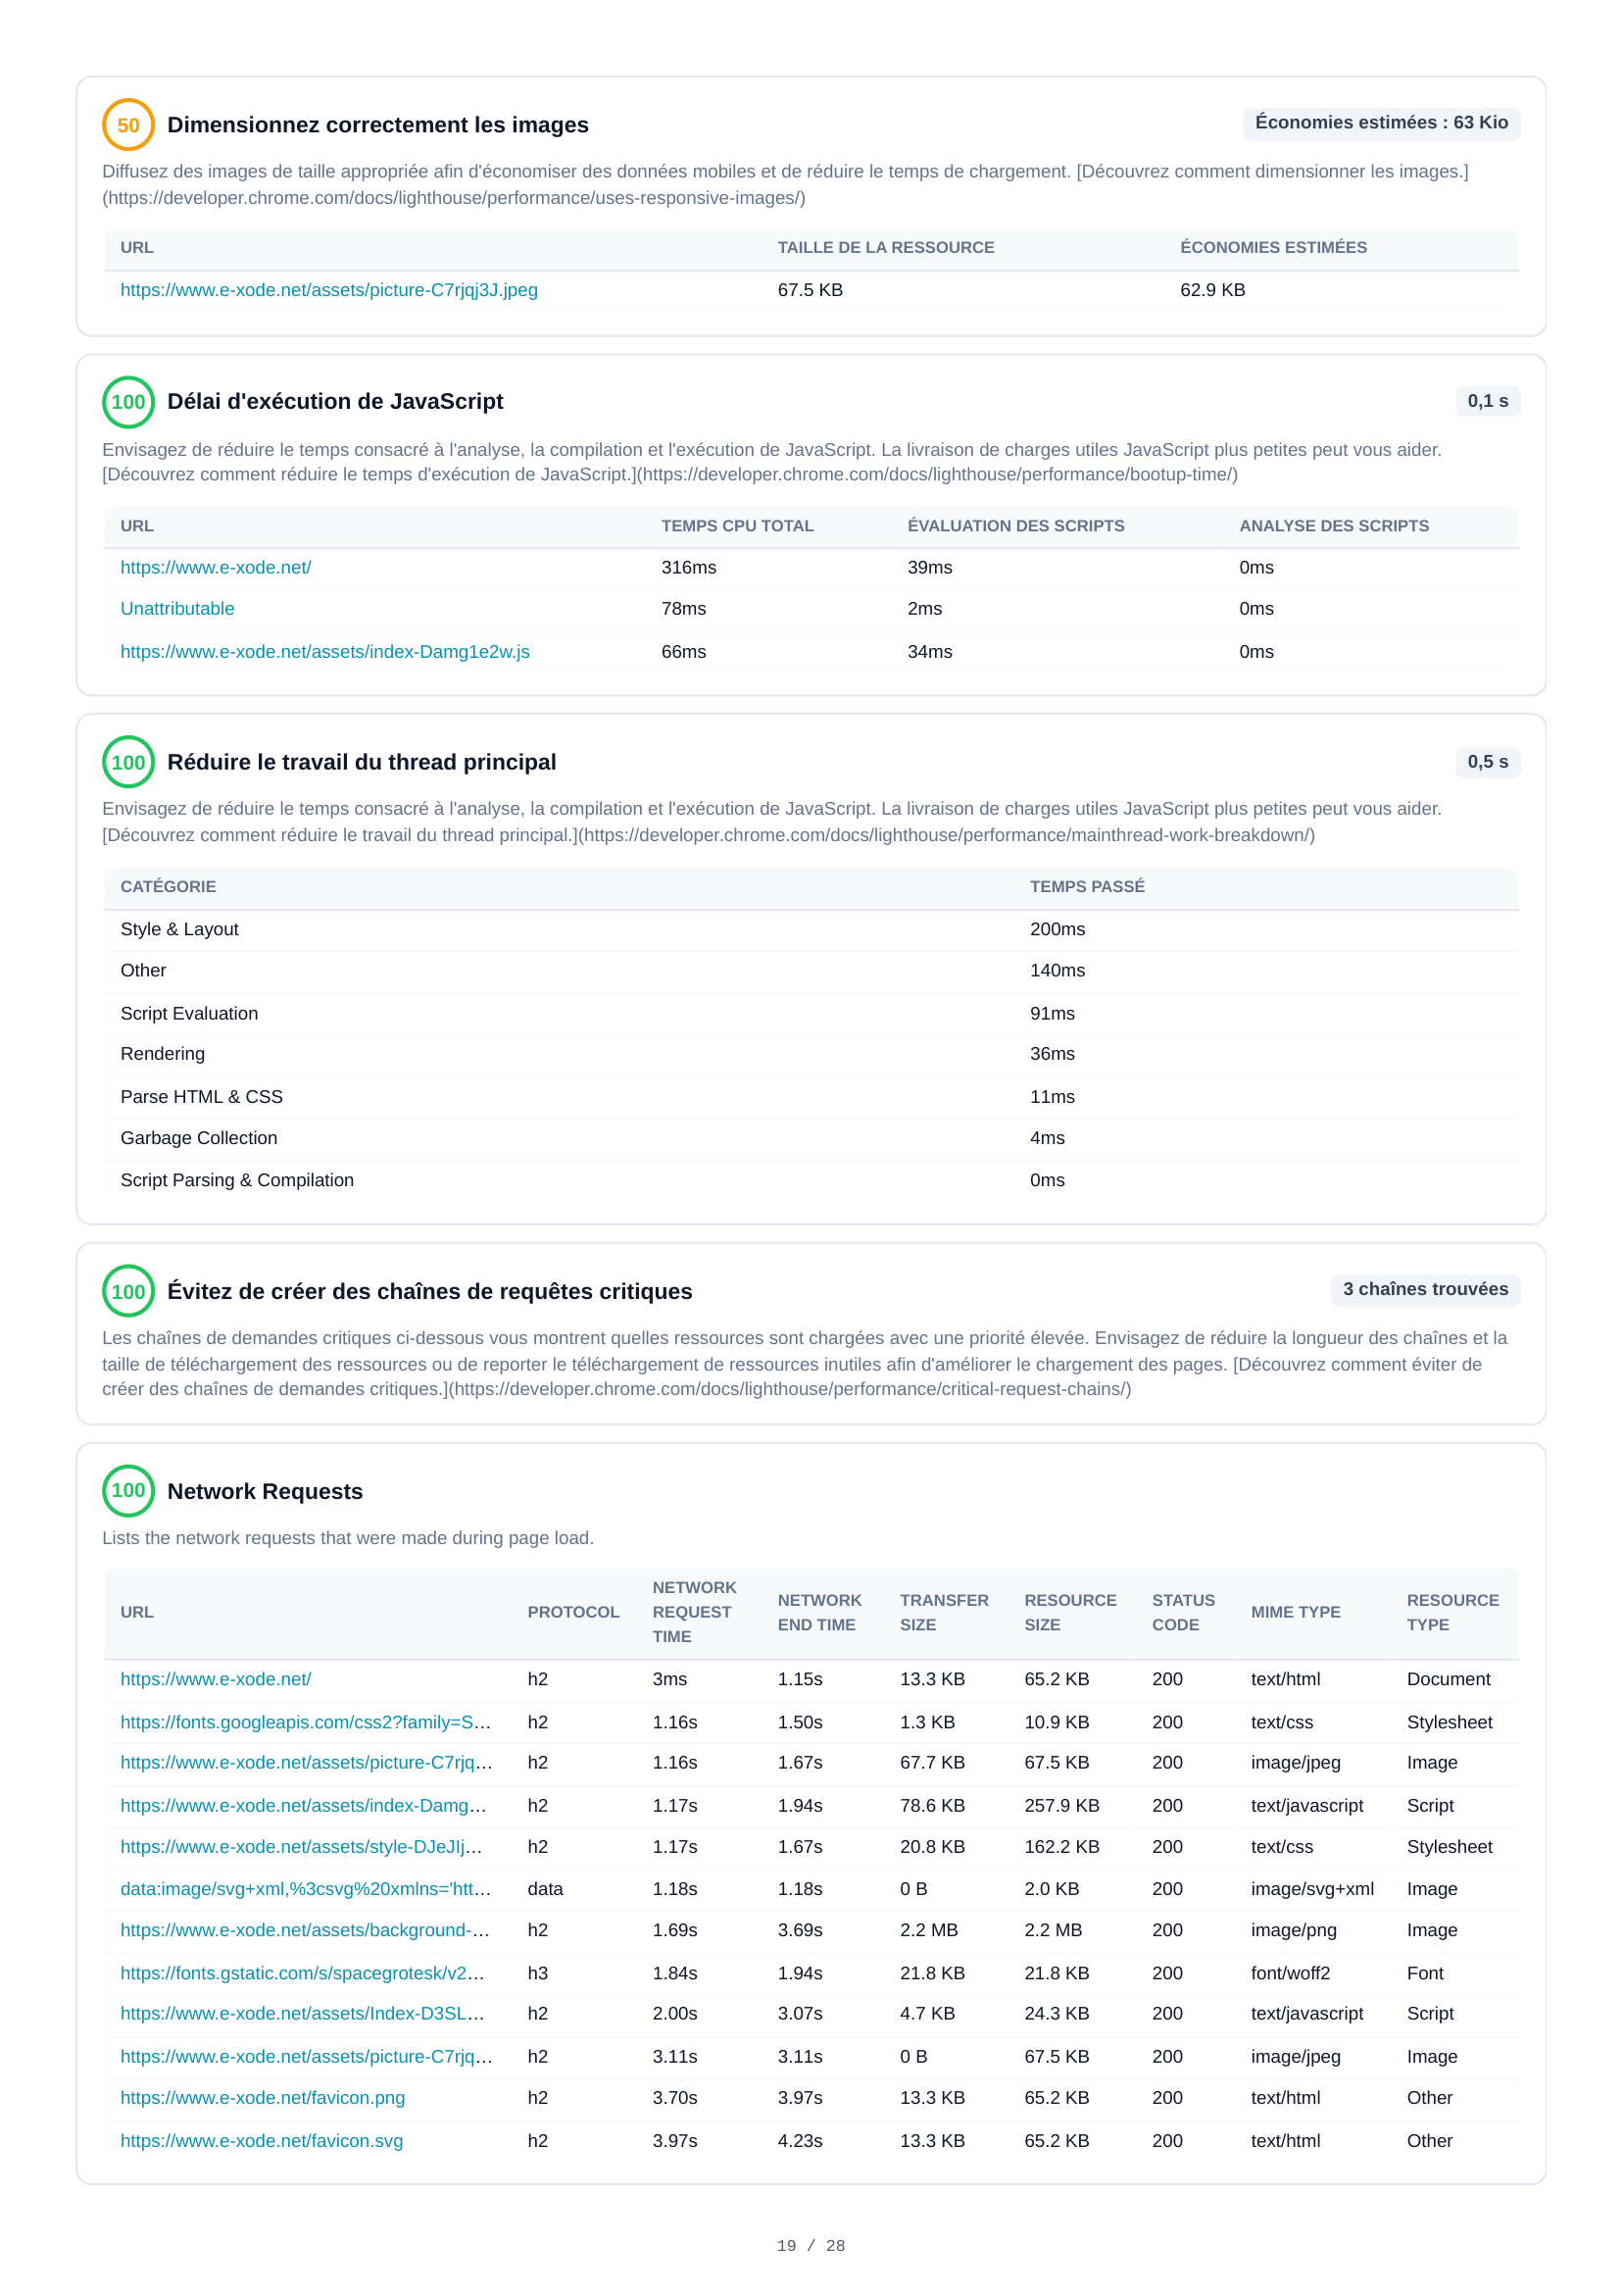
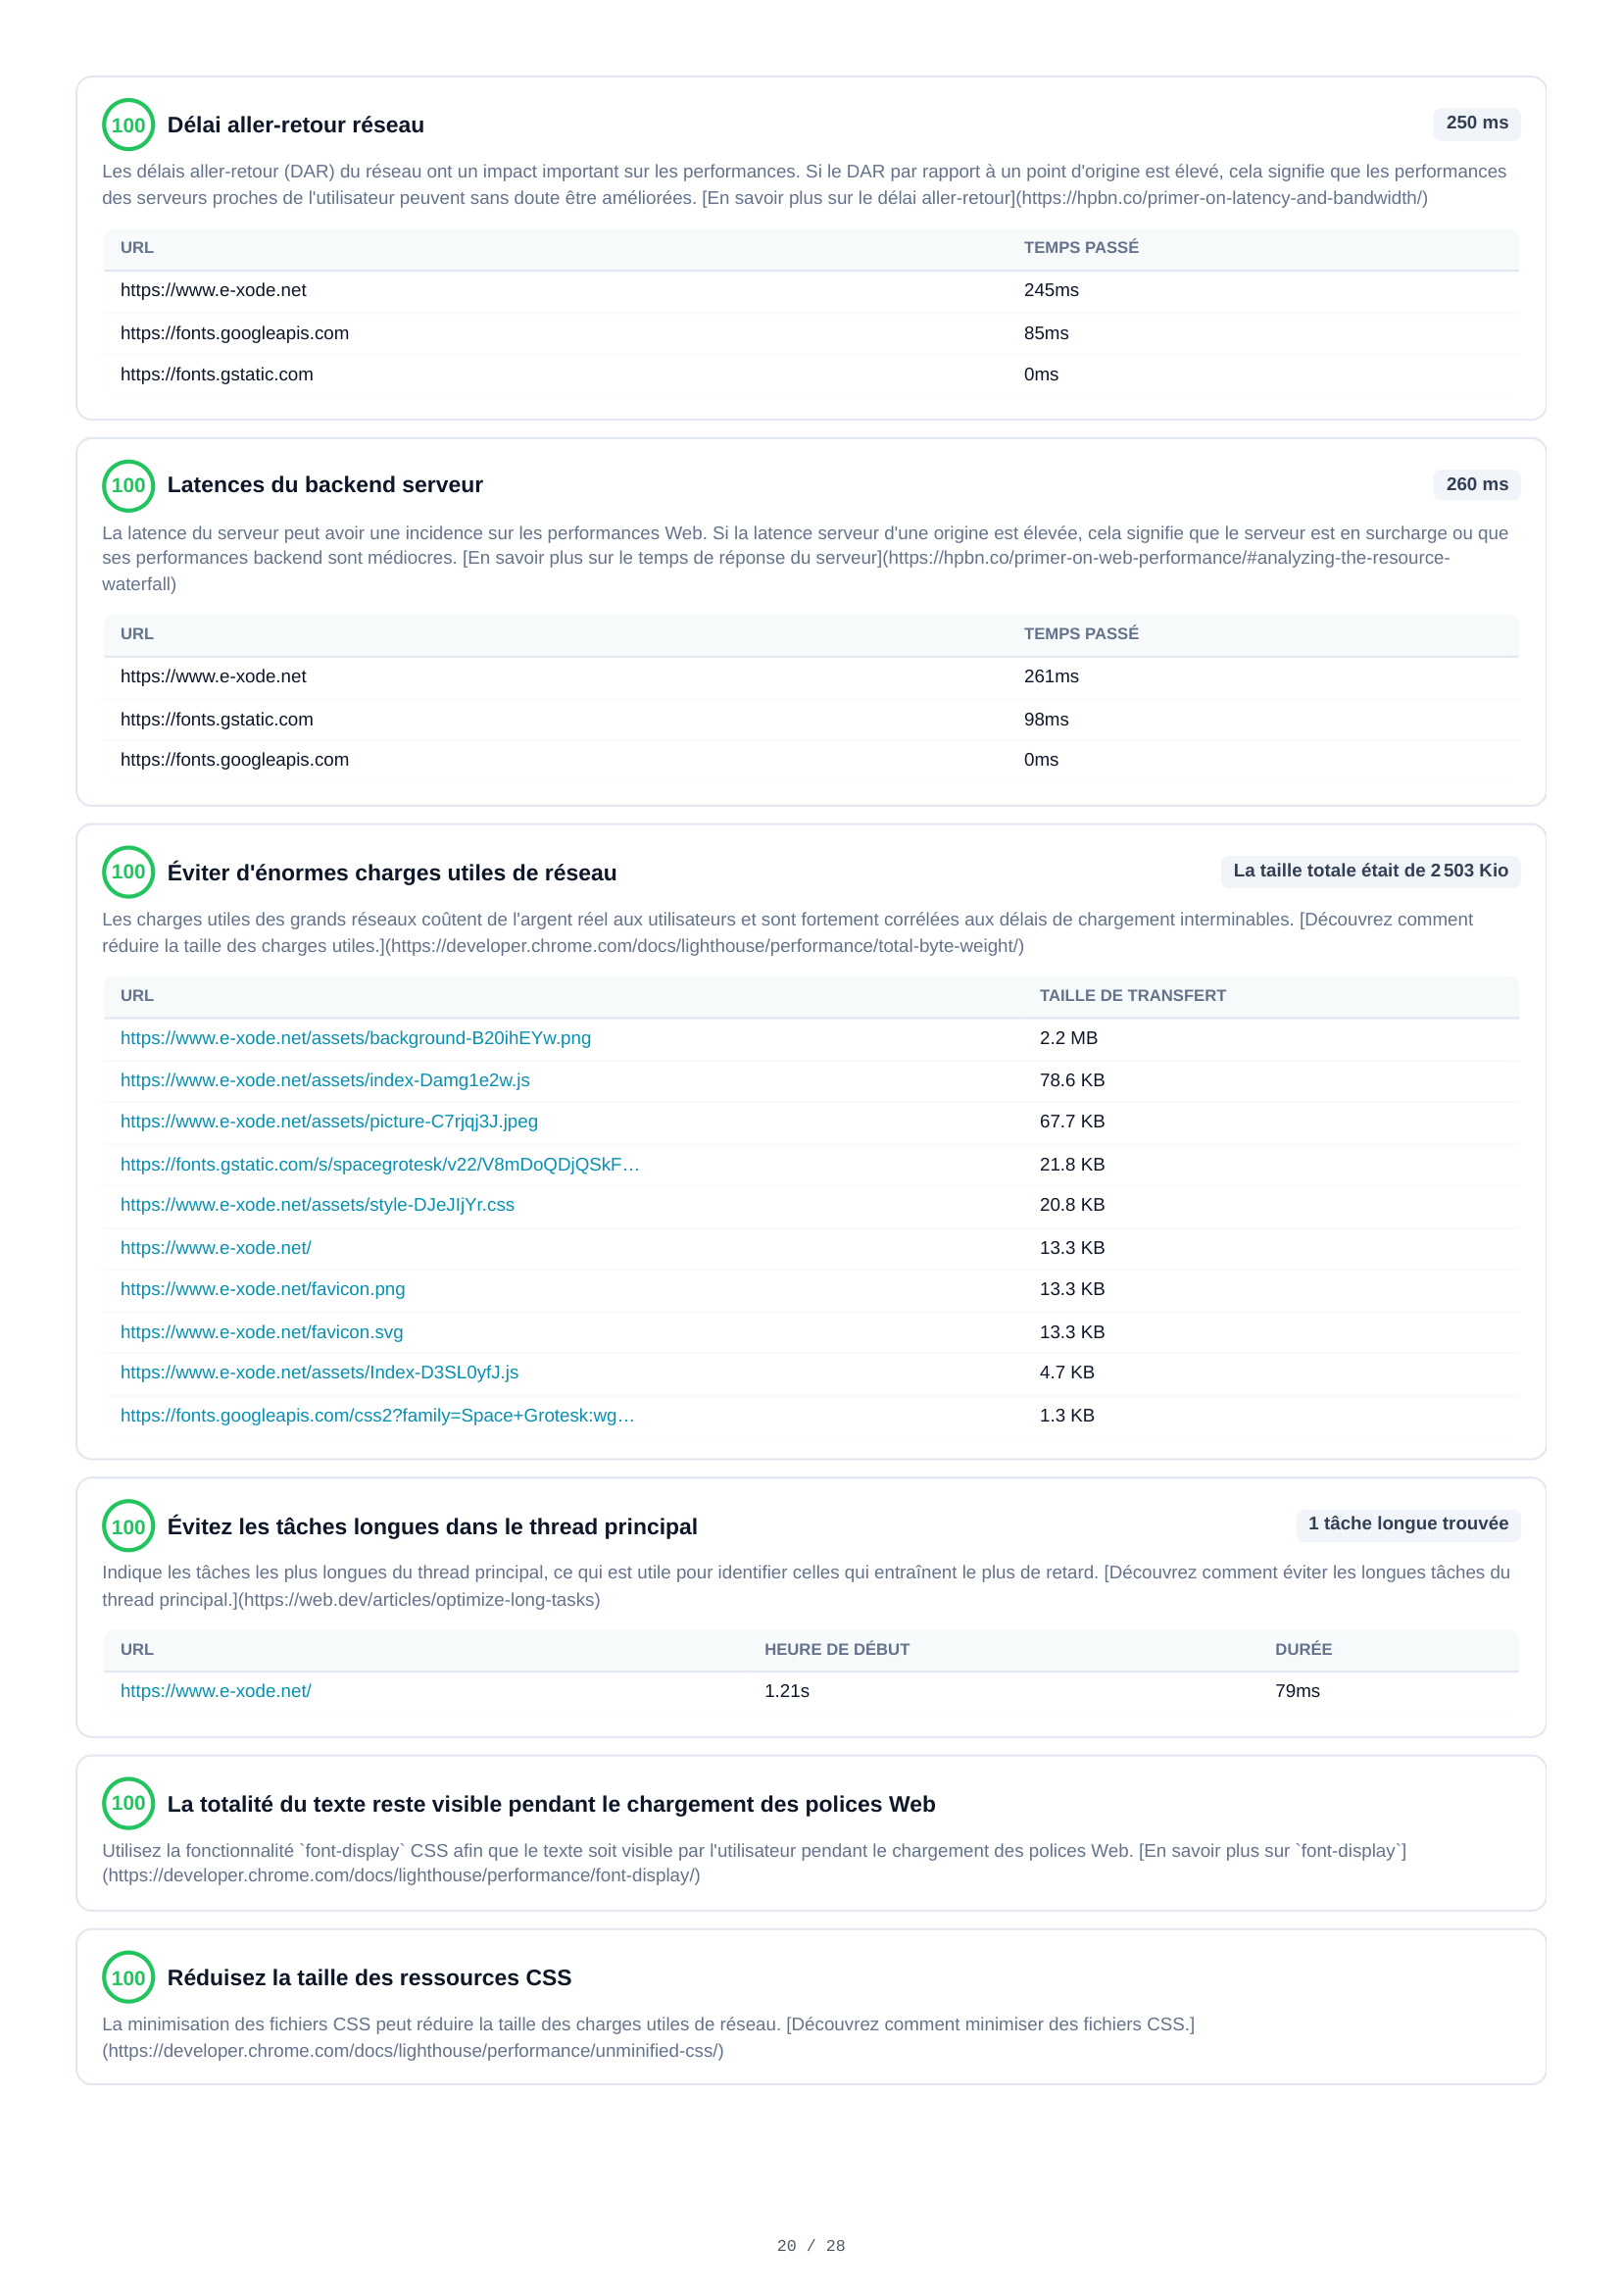
29 Diagnose-Audits erstrecken sich über 5 Seiten für die Desktop-Analyse. Erkenntnisse umfassen render-blockierende Ressourcen (geschätzte Einsparung 90 ms), Optimierungen bei der Bildgröße (potenzielle Einsparung 63 KB), Netzwerk-Roundtrip-Verzögerungen (250 ms), JavaScript- und CSS-Minimierung, nicht-zusammengesetzte Animations-Probleme sowie detaillierte Performance-Audits.
Desktop Ressourcen
Die Desktop-Ressourcenanalyse zeigt dieselben 24 Anfragen und 4,9 MB gesamt. Die Aufschlüsselung spiegelt Mobile wider: Bilder dominieren mit 2,4 MB, gefolgt von Skripten mit 2,3 MB. Ressourcendetails helfen dabei, die schwersten Assets für Optimierungen zu identifizieren.

Desktop Netzwerkanfragen
Alle 12 HTTP-Anfragen beim Desktop-Seitenaufruf mit vollständigen Details — URL, Typ, Protokoll, Status, Übertragungs- und Ressourcengrößen sowie Prioritätsstufen. Ermöglicht den direkten Vergleich mit dem Mobile-Netzwerkverhalten.

Desktop Layout-Verschiebungen & Script-Analyse
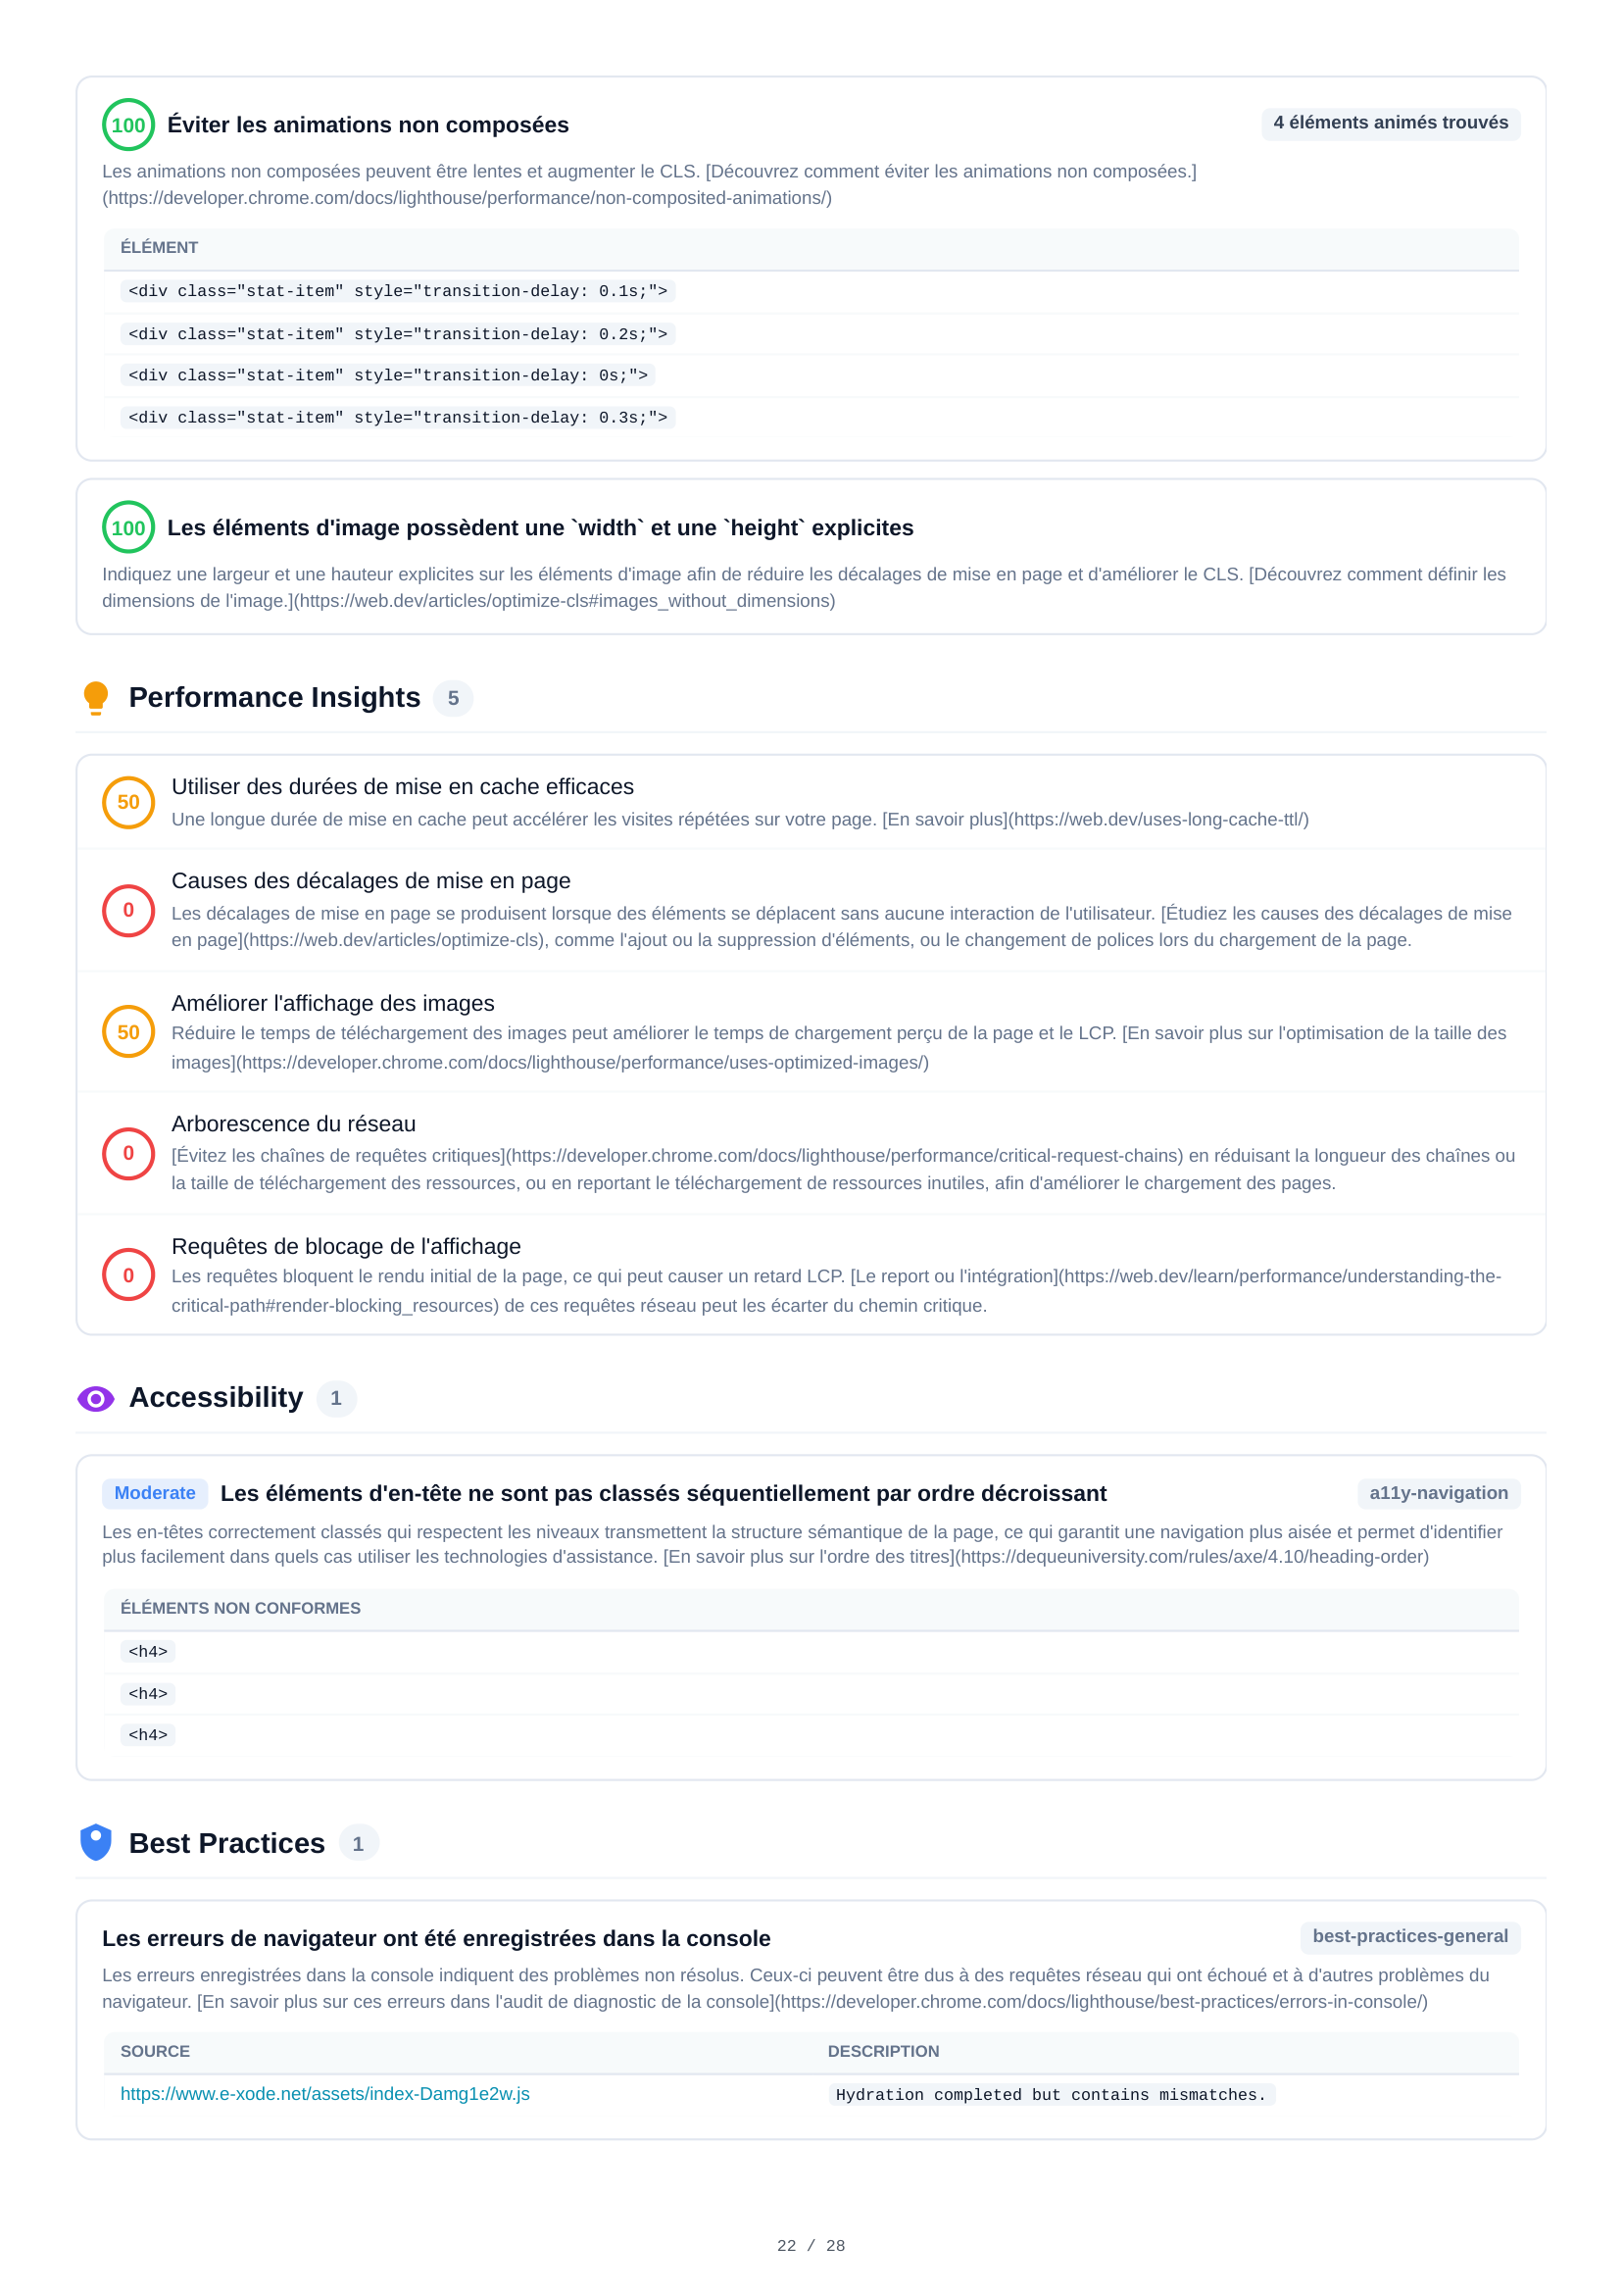
Die Desktop-Layout-Shift-Analyse zeigt 2 CLS-Ereignisse mit kombinierten Scores. Die Script-Treemap zeigt die JavaScript-Bundle-Zusammensetzung und Prozentsätze ungenutzten Codes. Die Konsole meldet 1 Hydration-Mismatch-Warnung — identisch mit Mobil, was ein codebedingtes Problem bestätigt, das nicht gerätespezifisch ist.
Desktop bestandene Audits
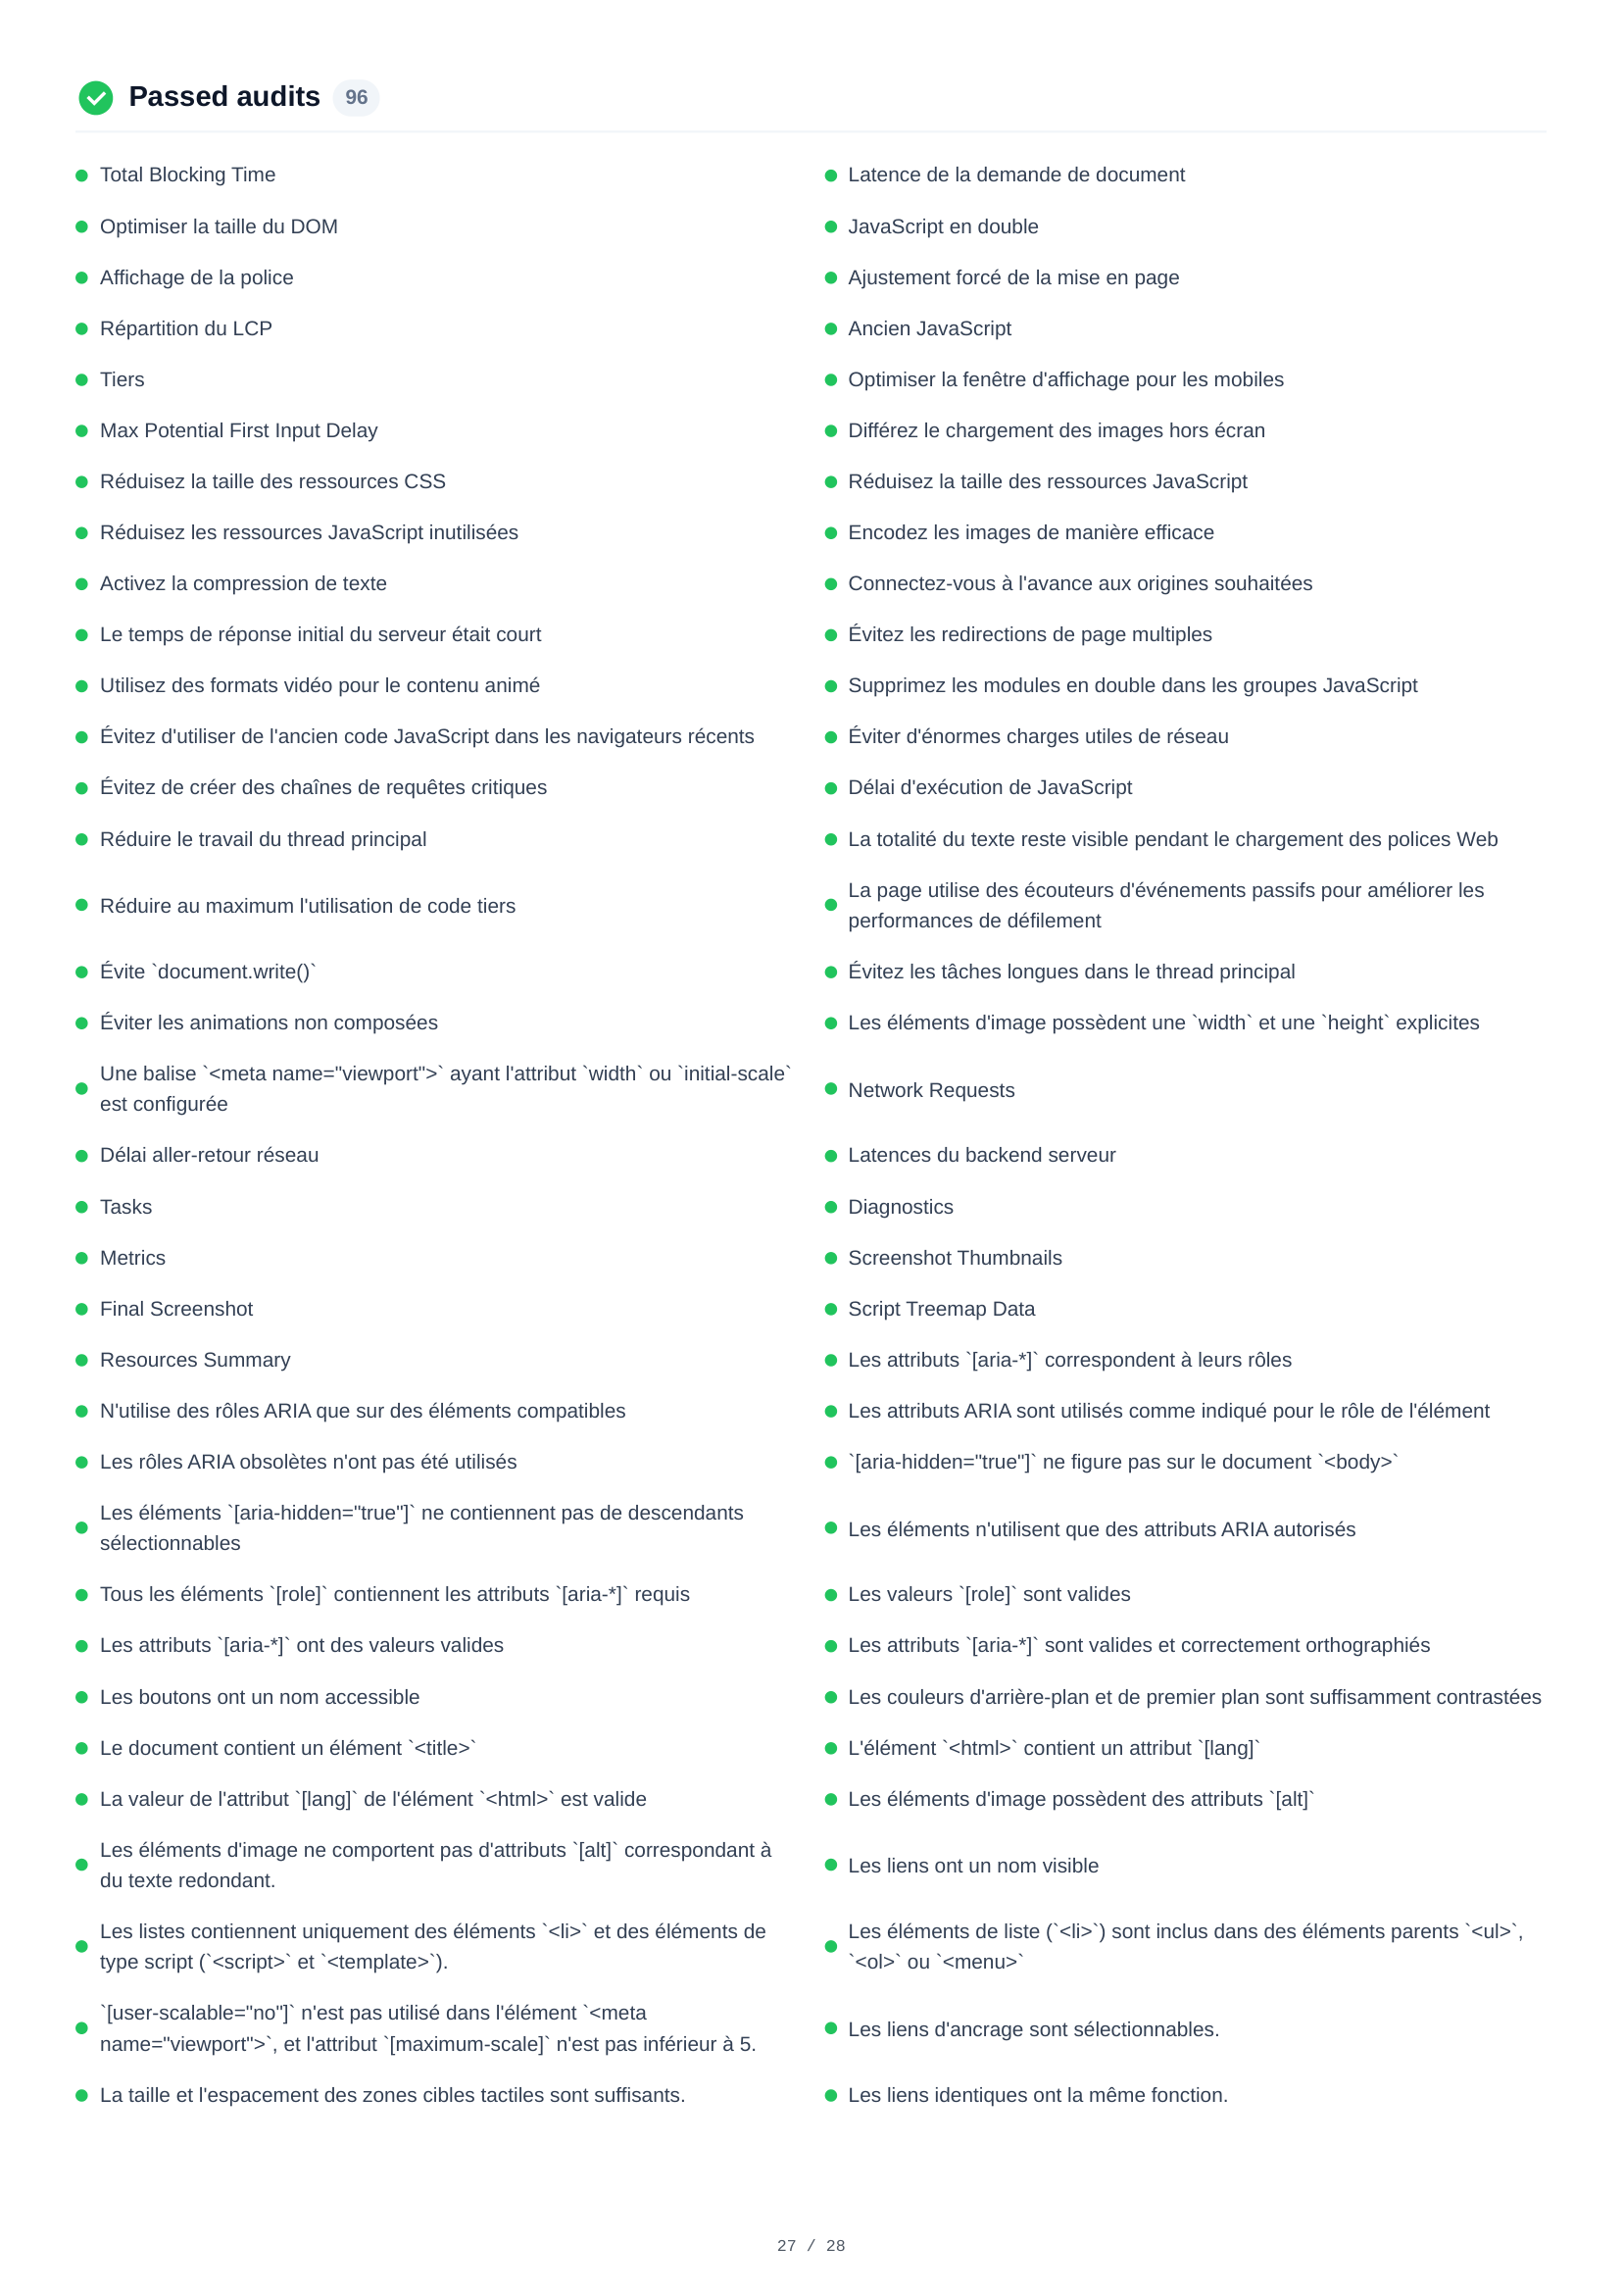
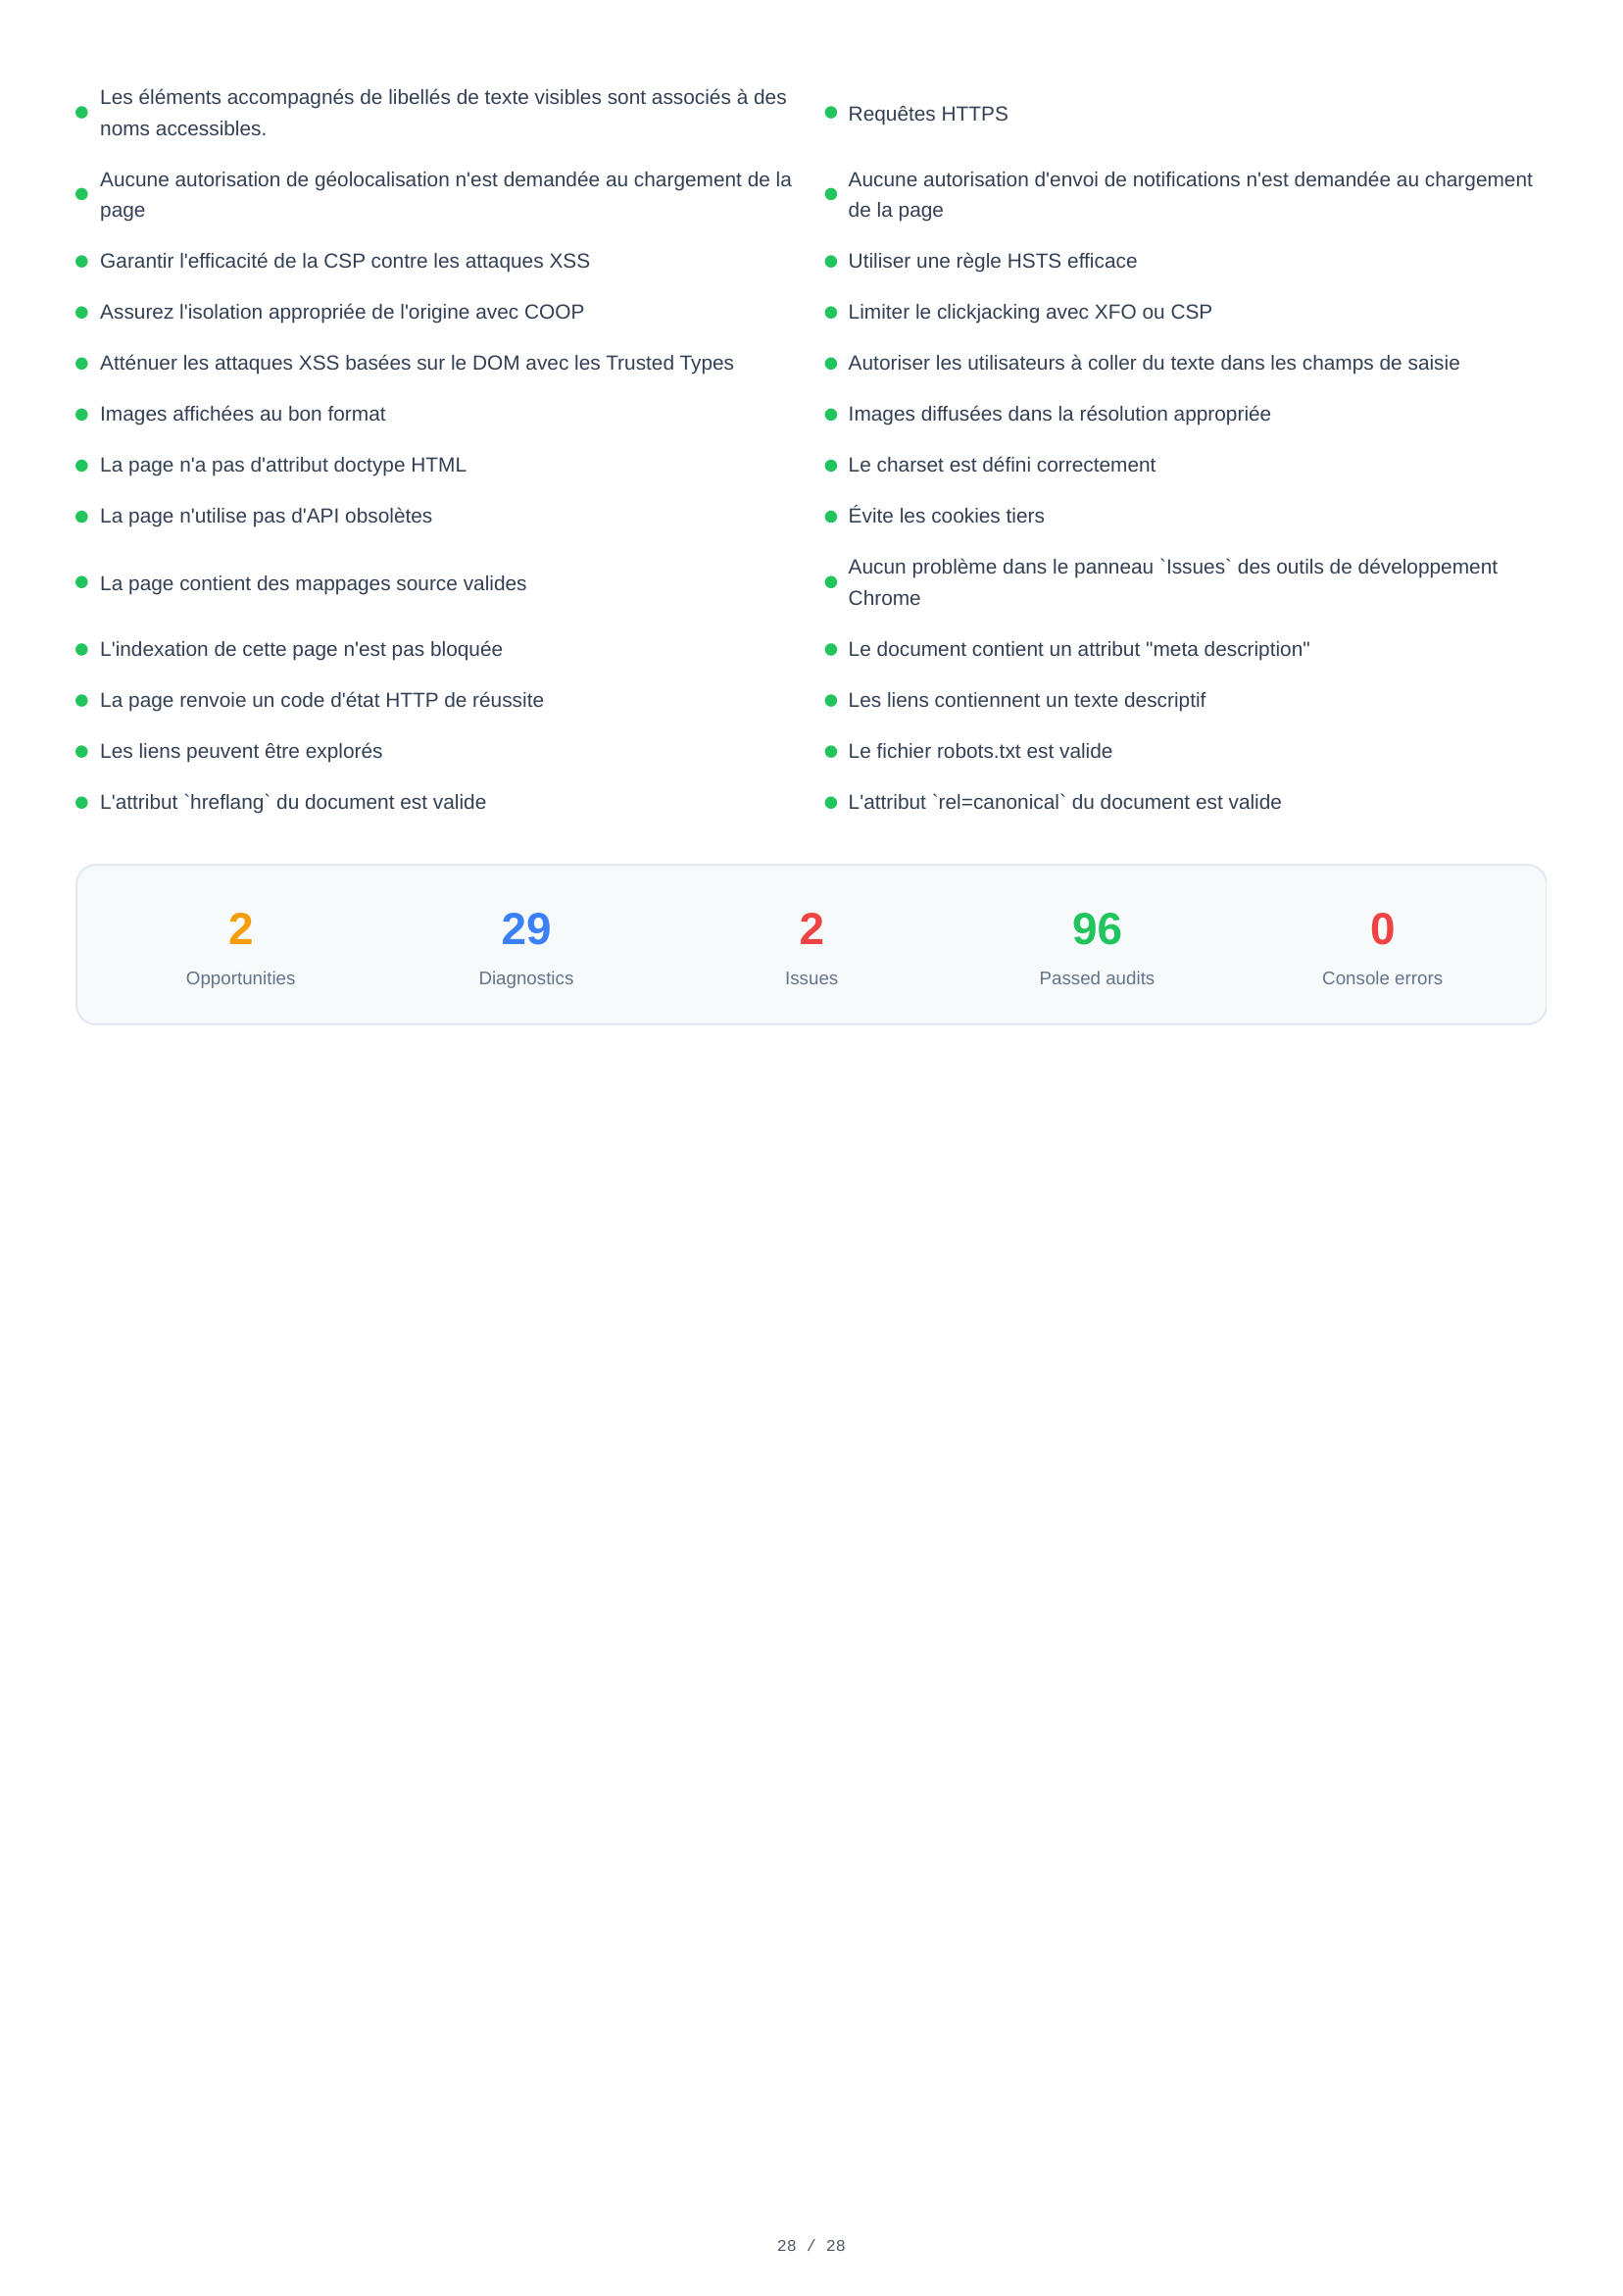
96 Audits auf Desktop bestanden — 2 mehr als auf Mobil — was eine insgesamt starke Konformität bestätigt. Die vollständige Liste umfasst Performance-Optimierungen, Barrierefreiheitsstandards, Sicherheits-Best-Practices und SEO-Anforderungen, die die Seite erfolgreich erfüllt.
Wesentliche Erkenntnisse
Perfekte SEO (100) und nahezu perfekte Barrierefreiheit (98) auf beiden Geräten. Ein Problem mit der Überschriften-Reihenfolge bleibt zu beheben.
Ein 2,3 MB großes Hintergrundbild macht fast die Hälfte des Seitengewichts von 4,9 MB aus. Responsives Sizing und ein modernes Format würden den LCP um über 1 Sekunde verbessern.
Keine TTL für 6 statische Assets bedeutet, dass Wiederholungsbesucher diese jedes Mal neu herunterladen. Eine Cache-Richtlinie ist eine einzeilige Korrektur.
VitaPulse vergleicht jeden Scan mit einer Referenz-Baseline und markiert Einbrüche bei Scores oder Core Web Vitals — so erfahren Sie, wenn ein Deploy die Performance beeinträchtigt.