Case Study: e-xode.net
Full audit of www.e-xode.net run on February 27, 2026 with Lighthouse 13. A 28-page report covering performance, accessibility, SEO, and best practices on mobile and desktop.
Audit overview
VitaPulse produced a 28-page PDF for www.e-xode.net using Lighthouse 13. The report covers mobile and desktop: scores, Core Web Vitals, performance insights, diagnostics, quality issues, resource breakdown, and regression detection. Same format as every VitaPulse audit — the shareable report your clients can read without an account.
Key Audit Metrics
Audit Cover & Scores Overview
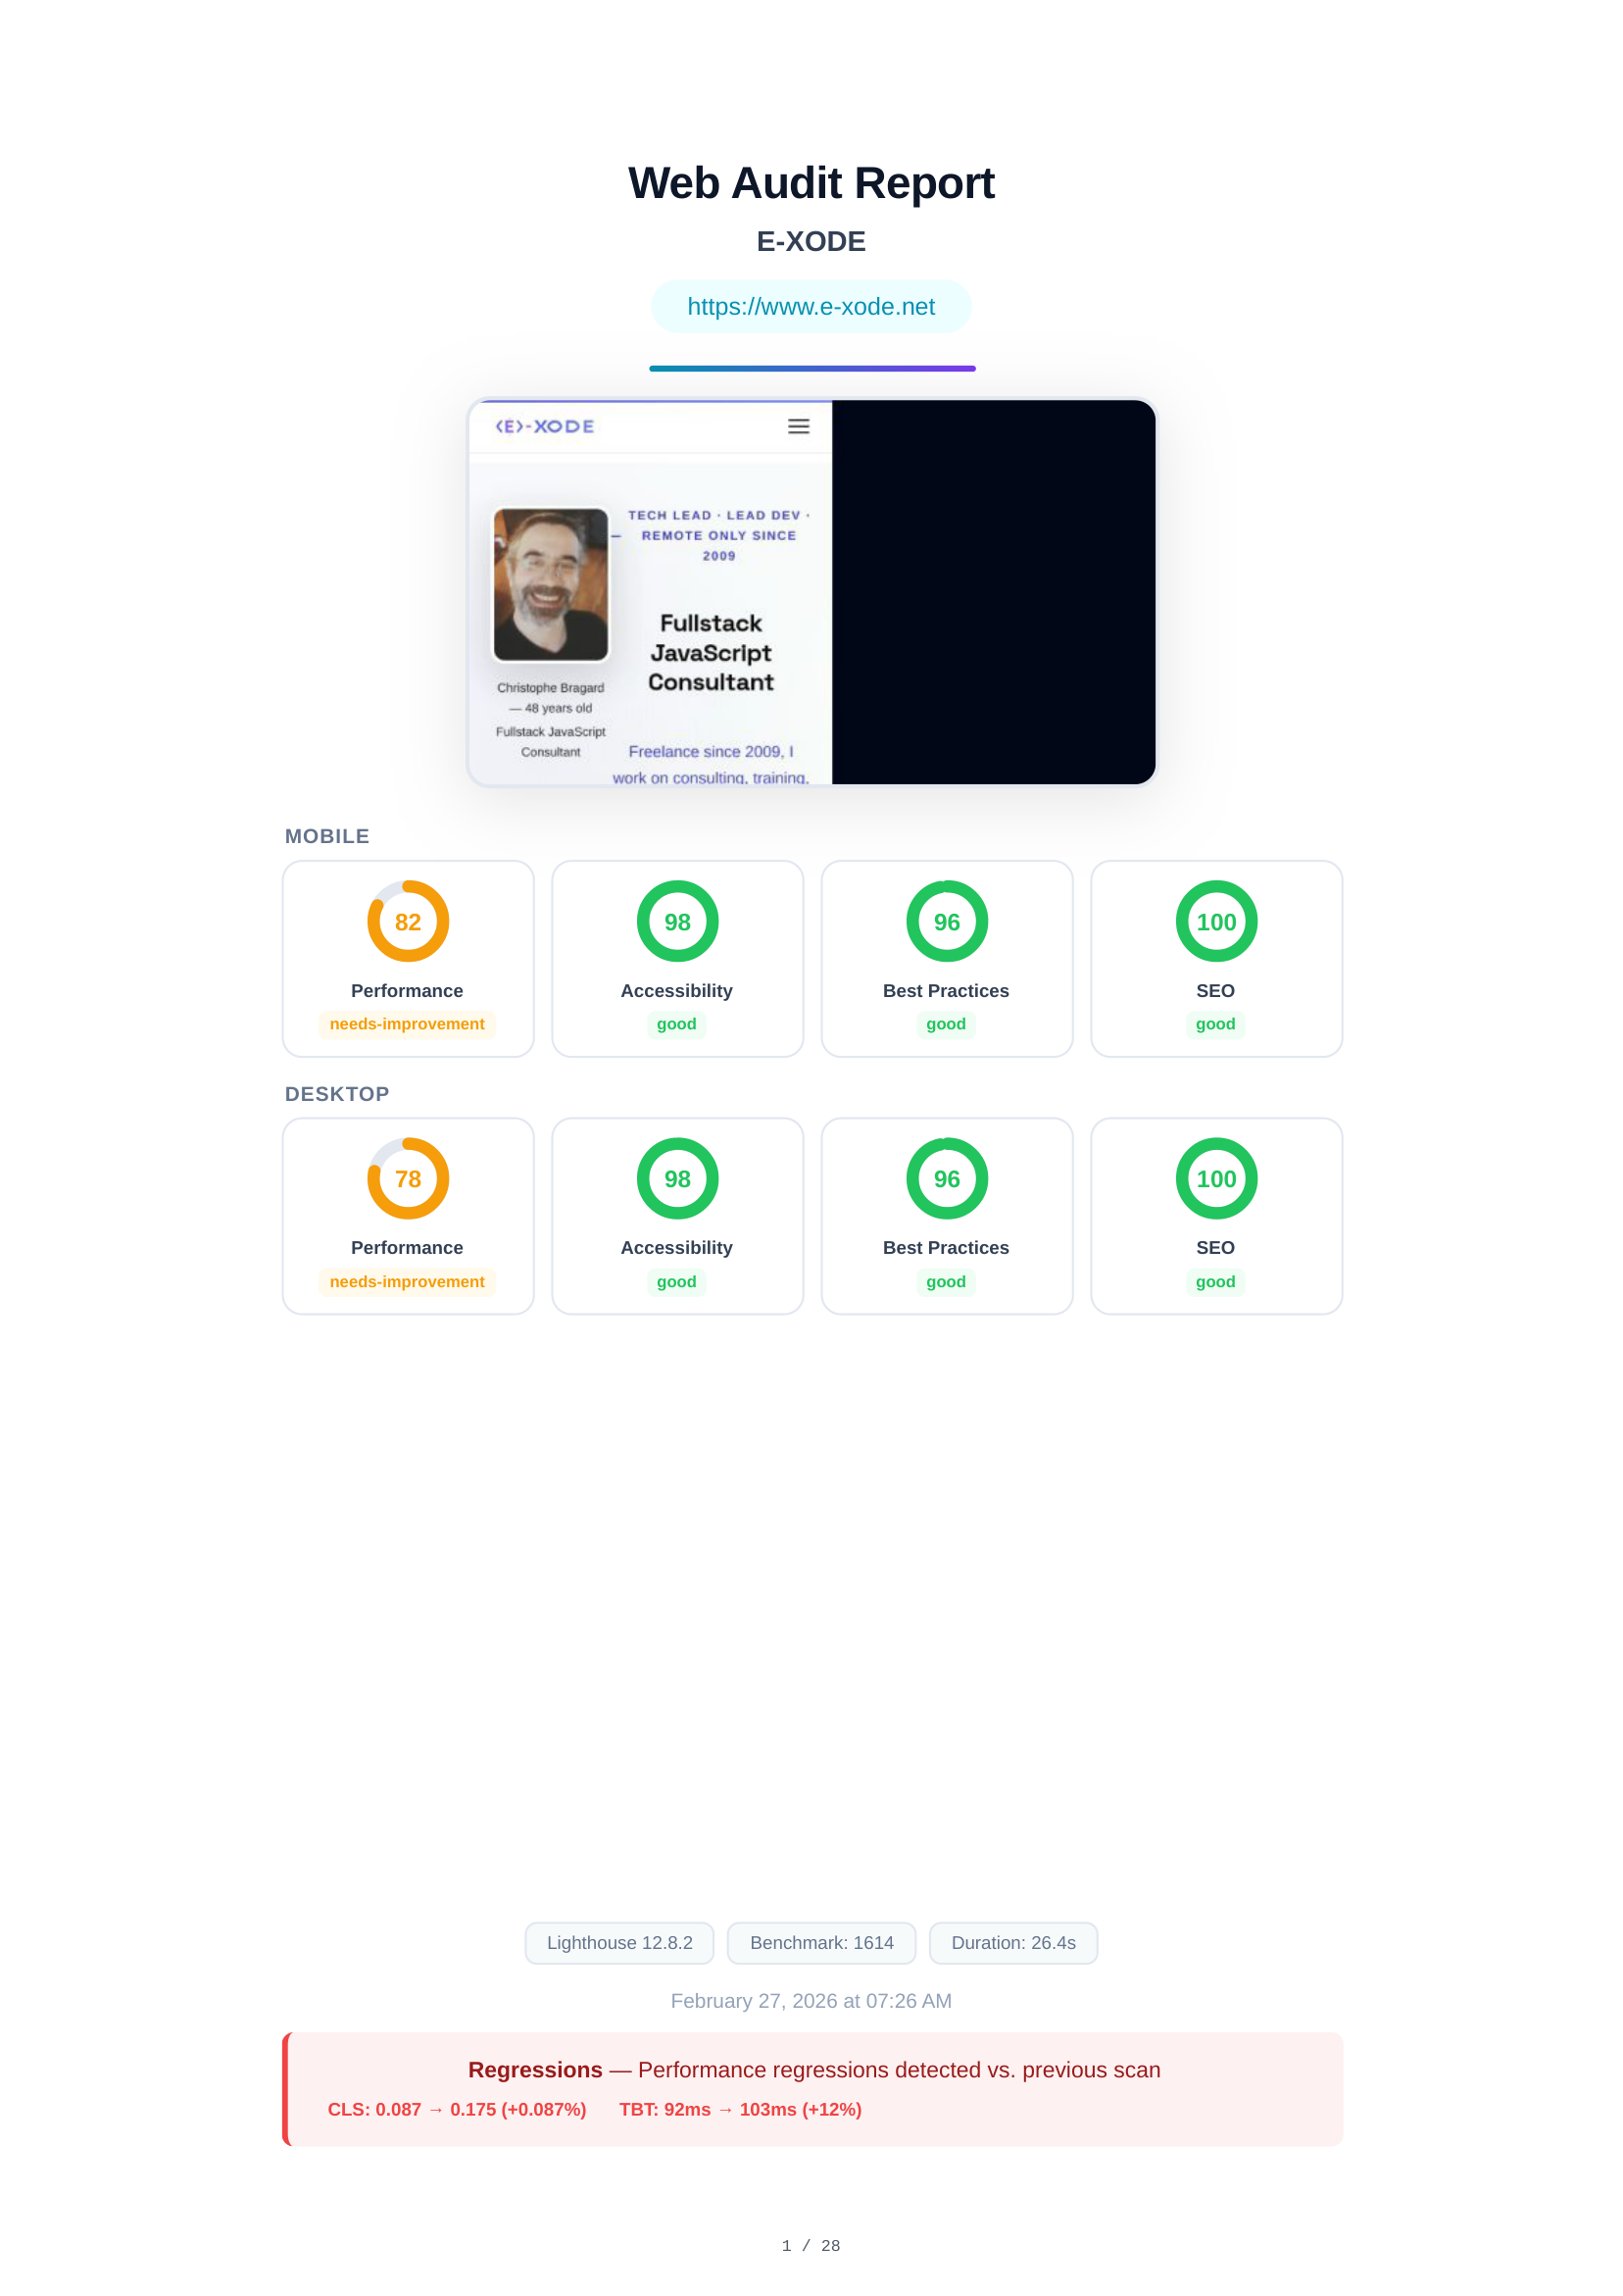
The cover page presents the audited URL (www.e-xode.net), a full-page screenshot, and a summary of all Lighthouse scores for both mobile and desktop. Mobile: Performance 82, Accessibility 98, Best Practices 96, SEO 100. Desktop: Performance 78, Accessibility 98, Best Practices 96, SEO 100.
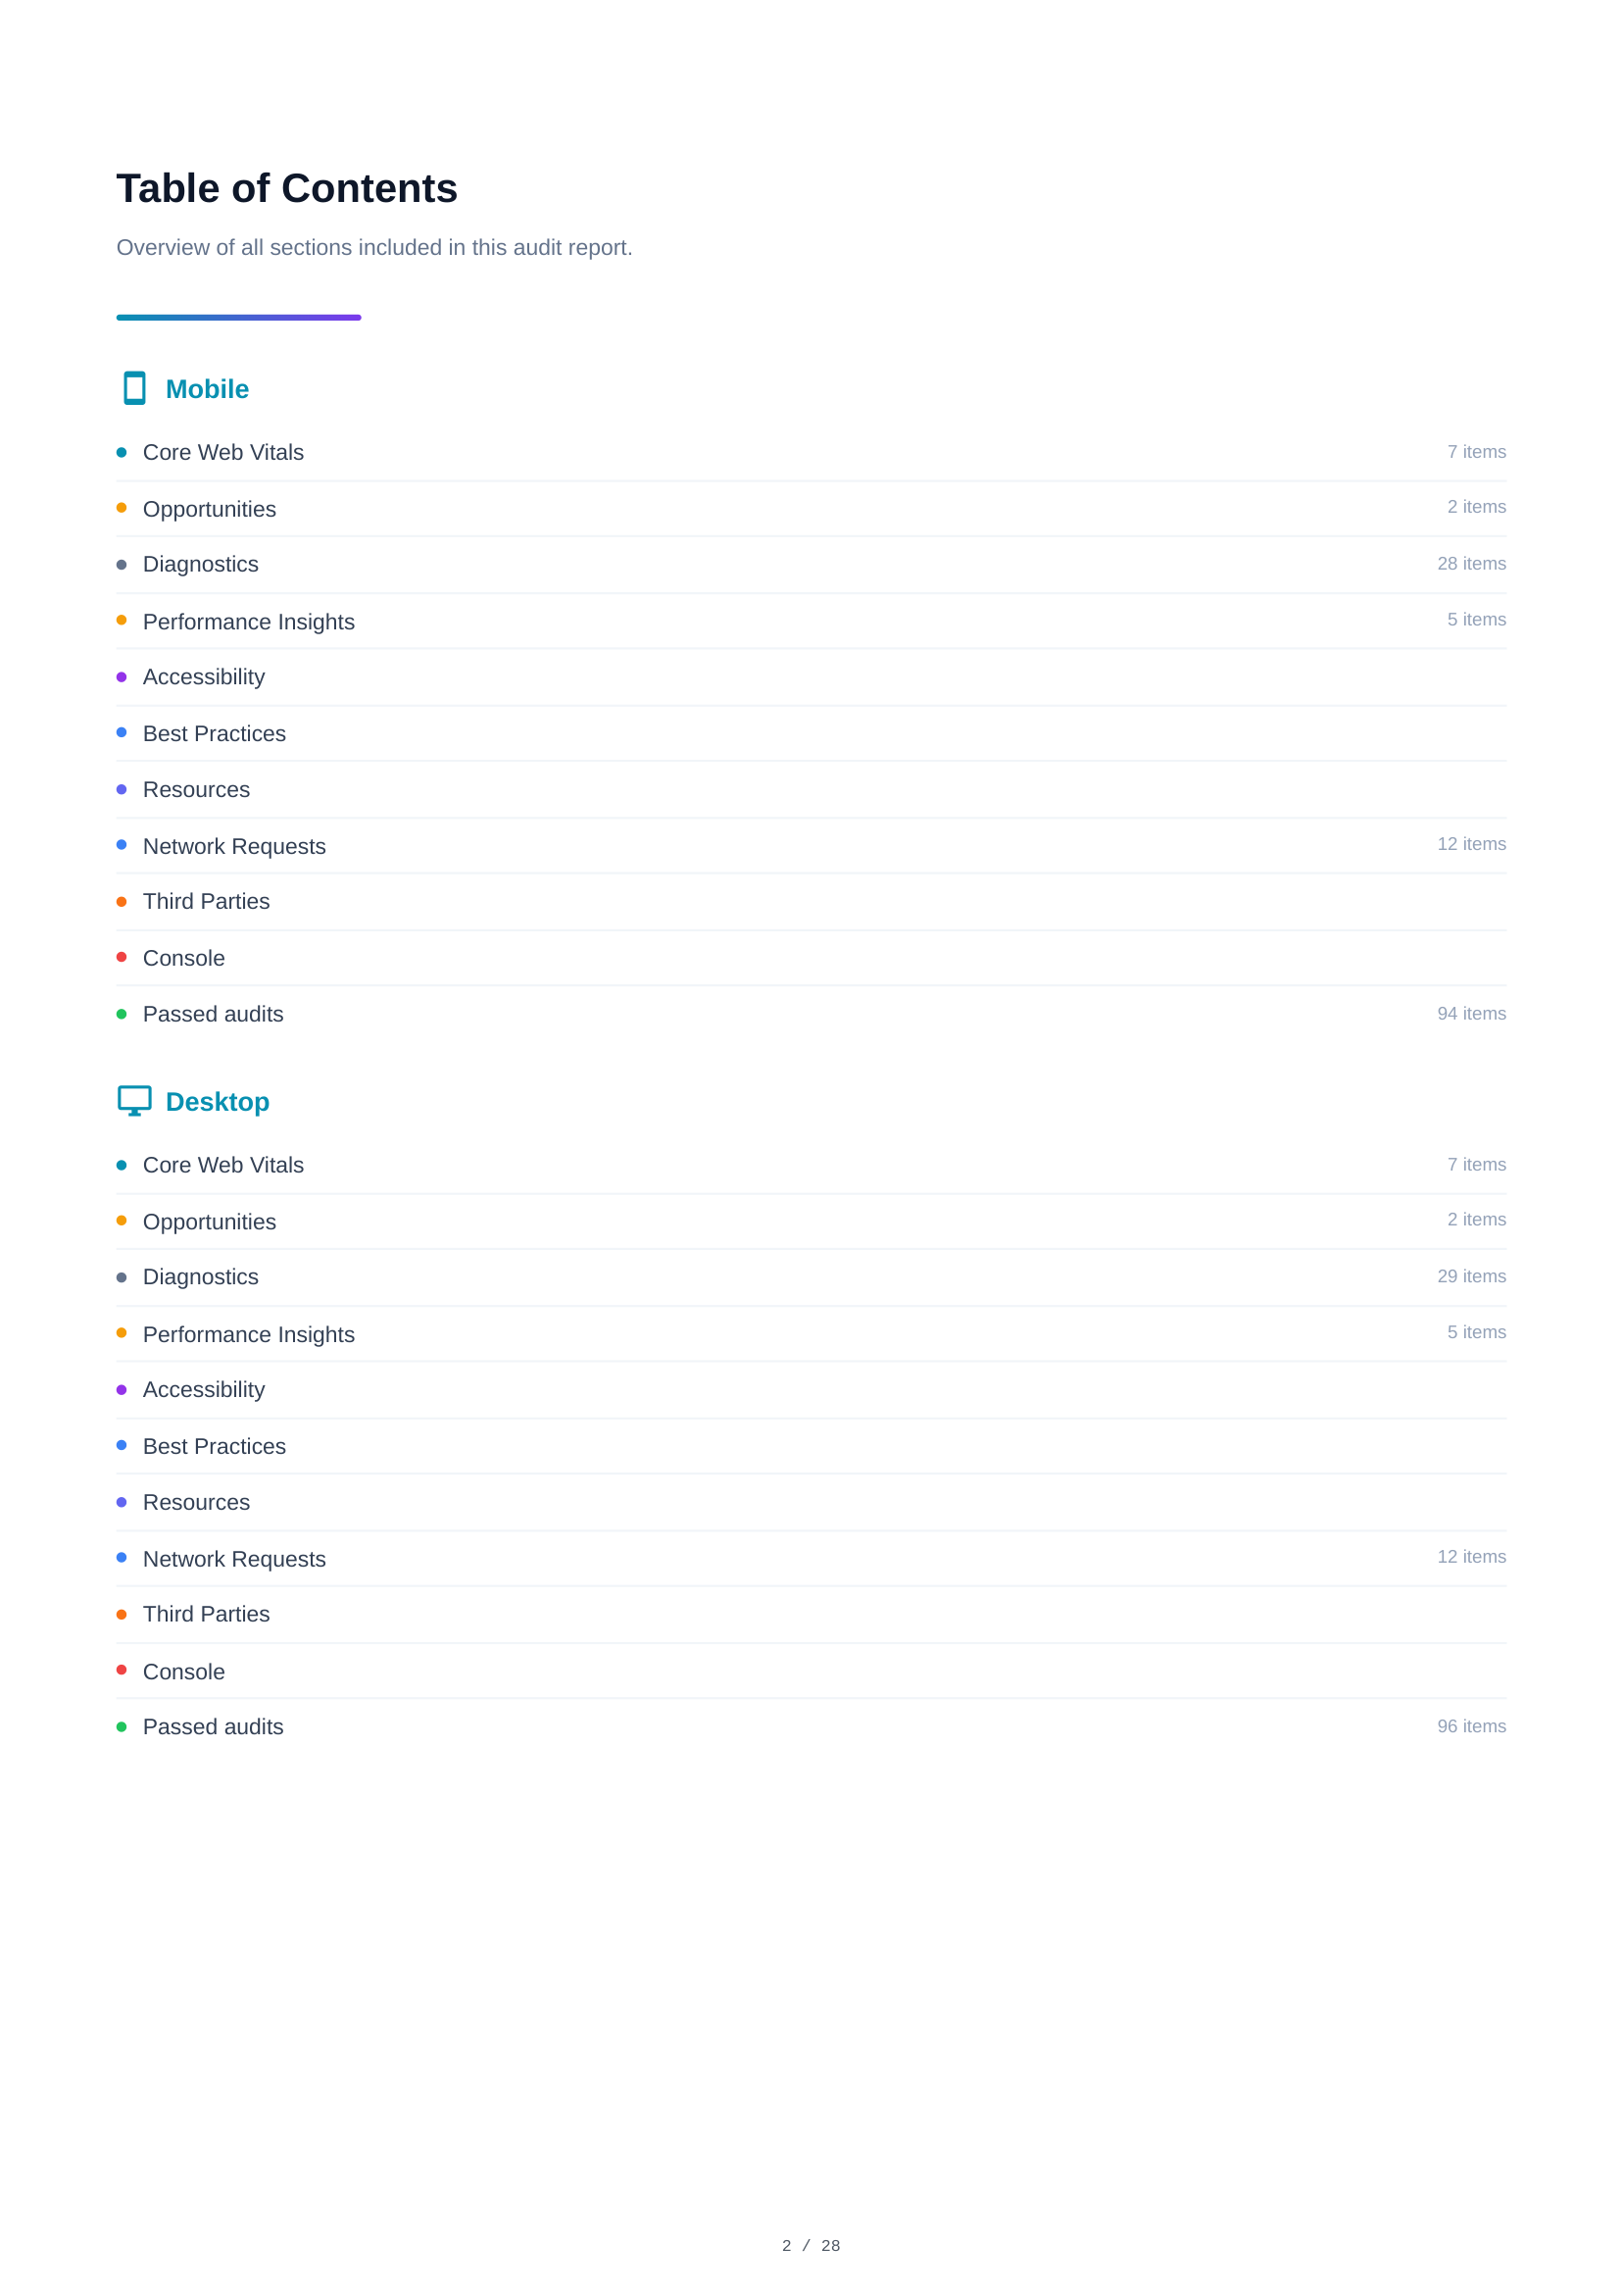
Table of Contents
The table of contents provides a navigable overview of all report sections. It lists every audit category with item counts — Core Web Vitals, Opportunities, Diagnostics, Performance Insights, Accessibility, Best Practices, SEO, Resources, and more — for both mobile and desktop analysis.
Mobile Scores & Core Web Vitals
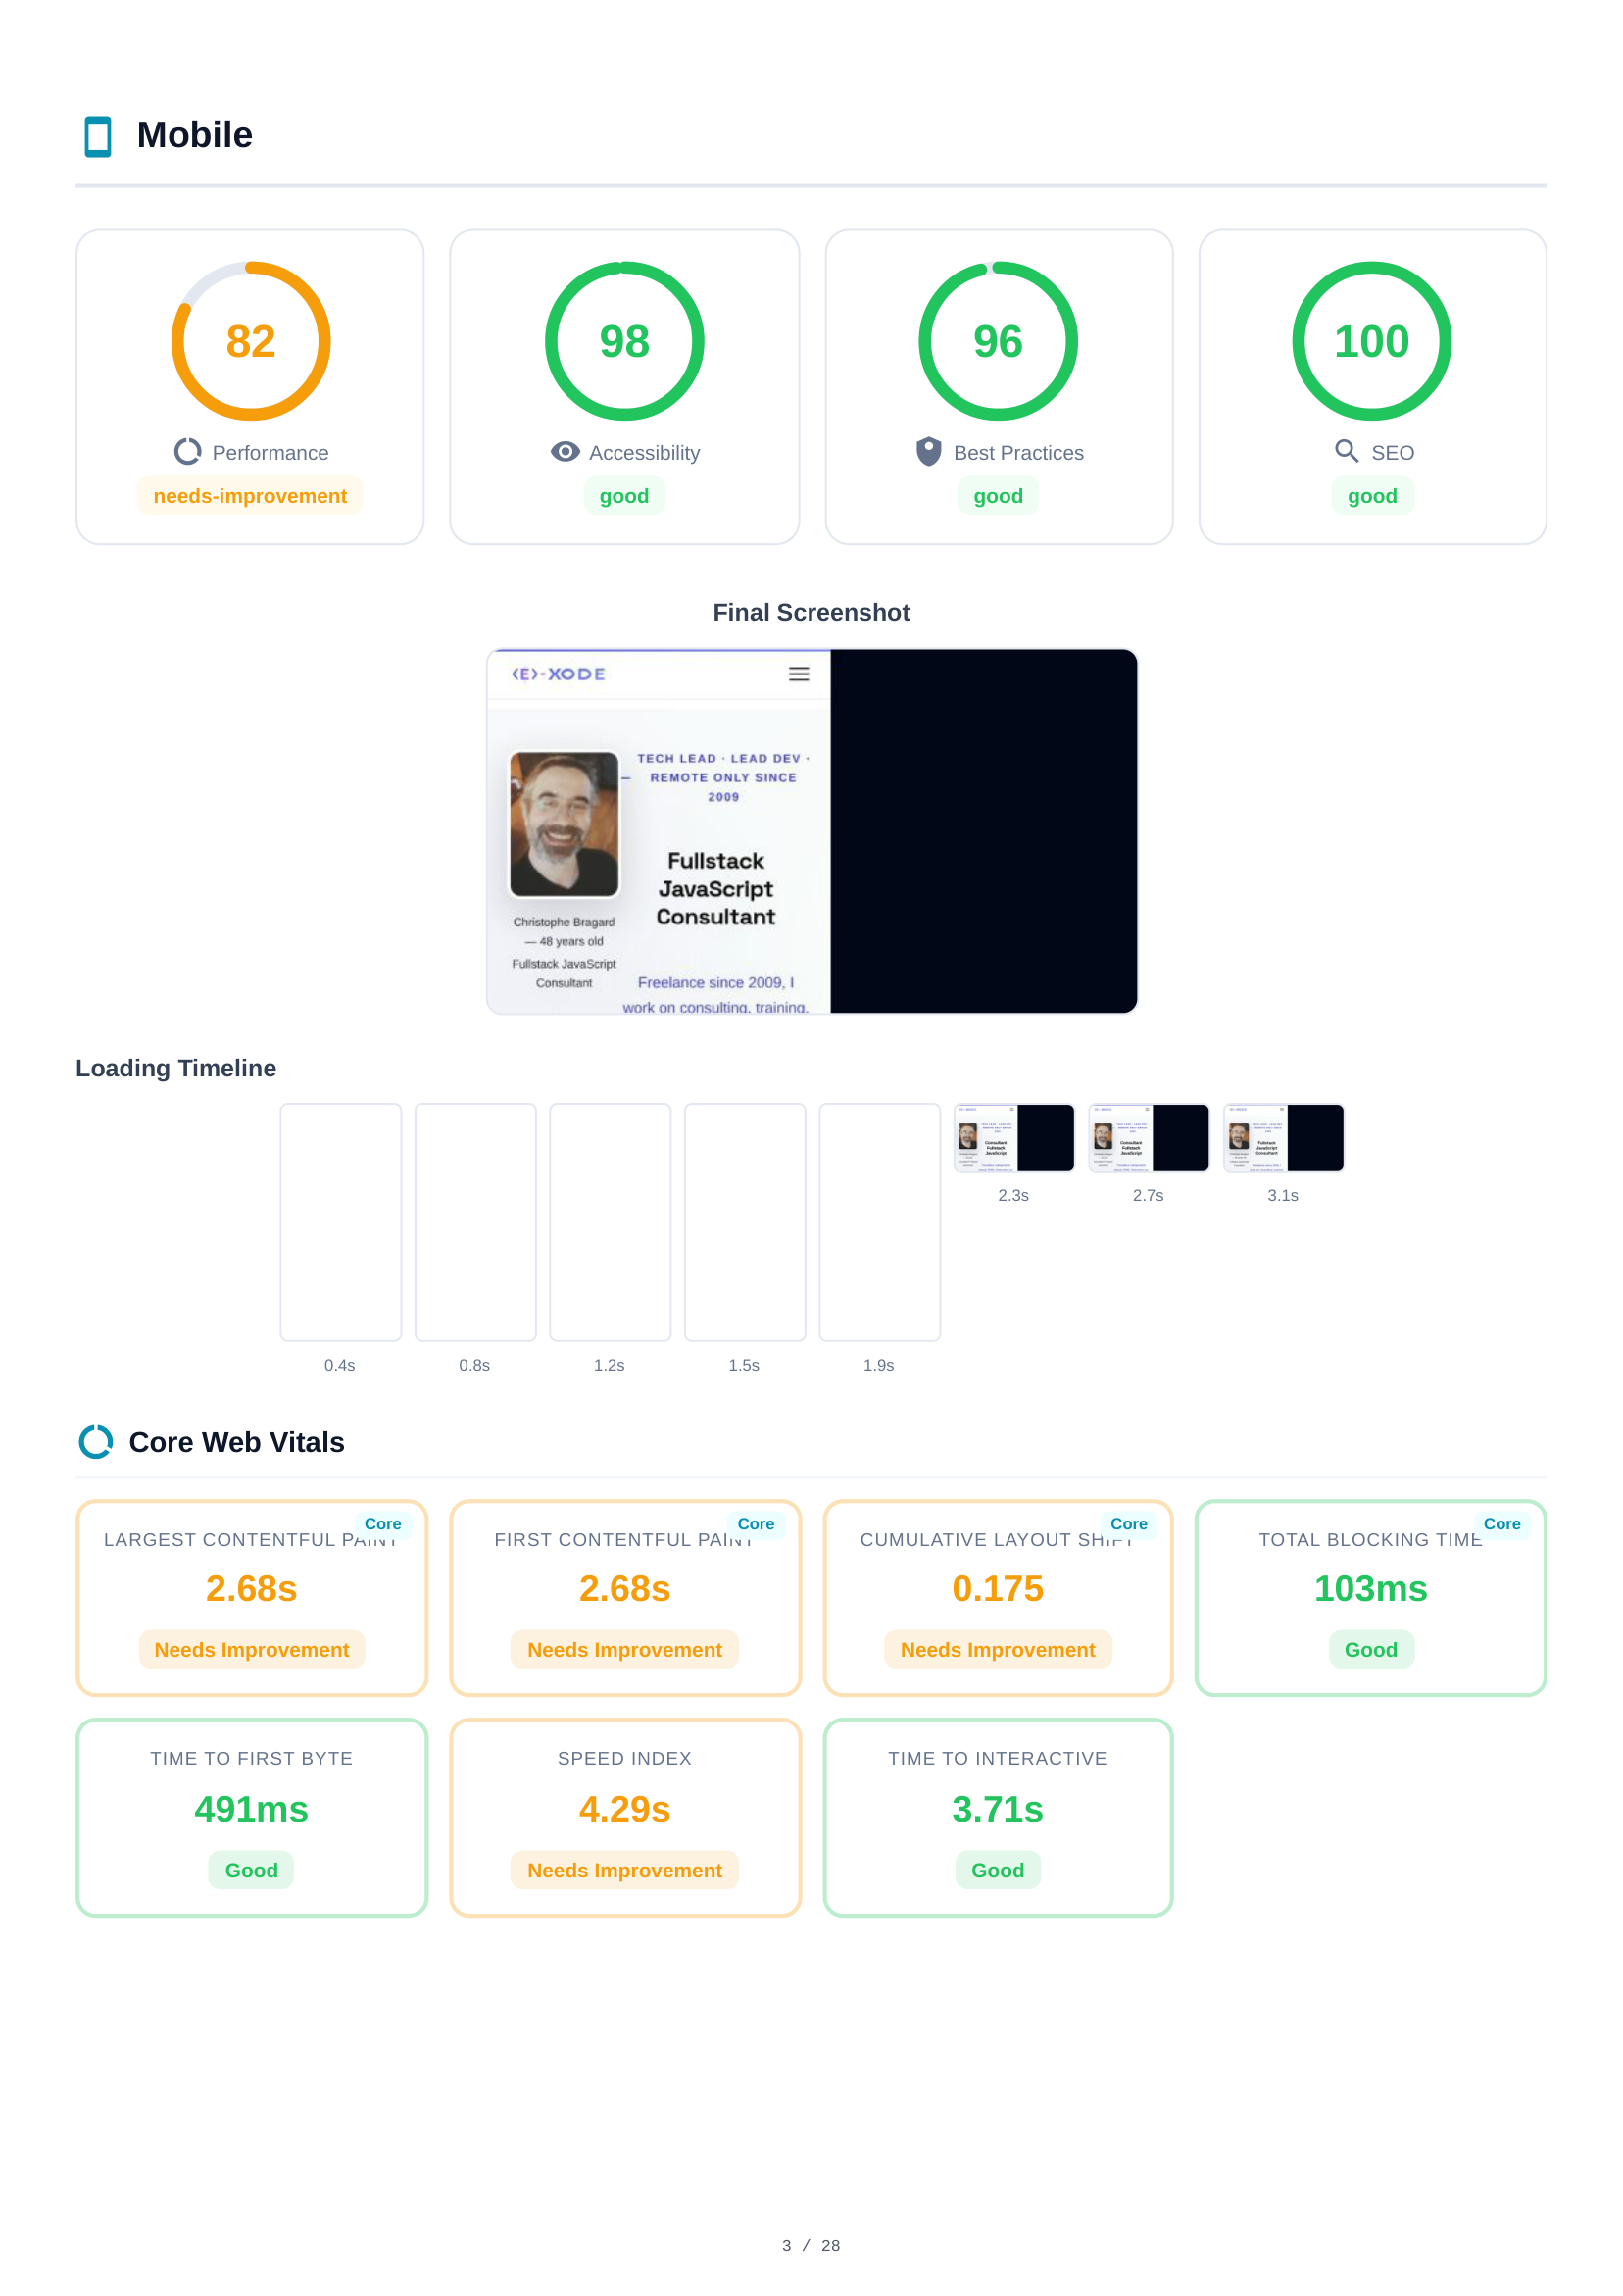
The mobile analysis opens with 4 Lighthouse scores — Performance (82), Accessibility (98), Best Practices (96), SEO (100) — displayed as color-coded gauges. Below, a final screenshot and loading timeline visualize how the page renders over time. Core Web Vitals metrics follow: Largest Contentful Paint (LCP), Cumulative Layout Shift (CLS), Total Blocking Time (TBT), First Contentful Paint (FCP), and Speed Index.
Mobile Opportunities
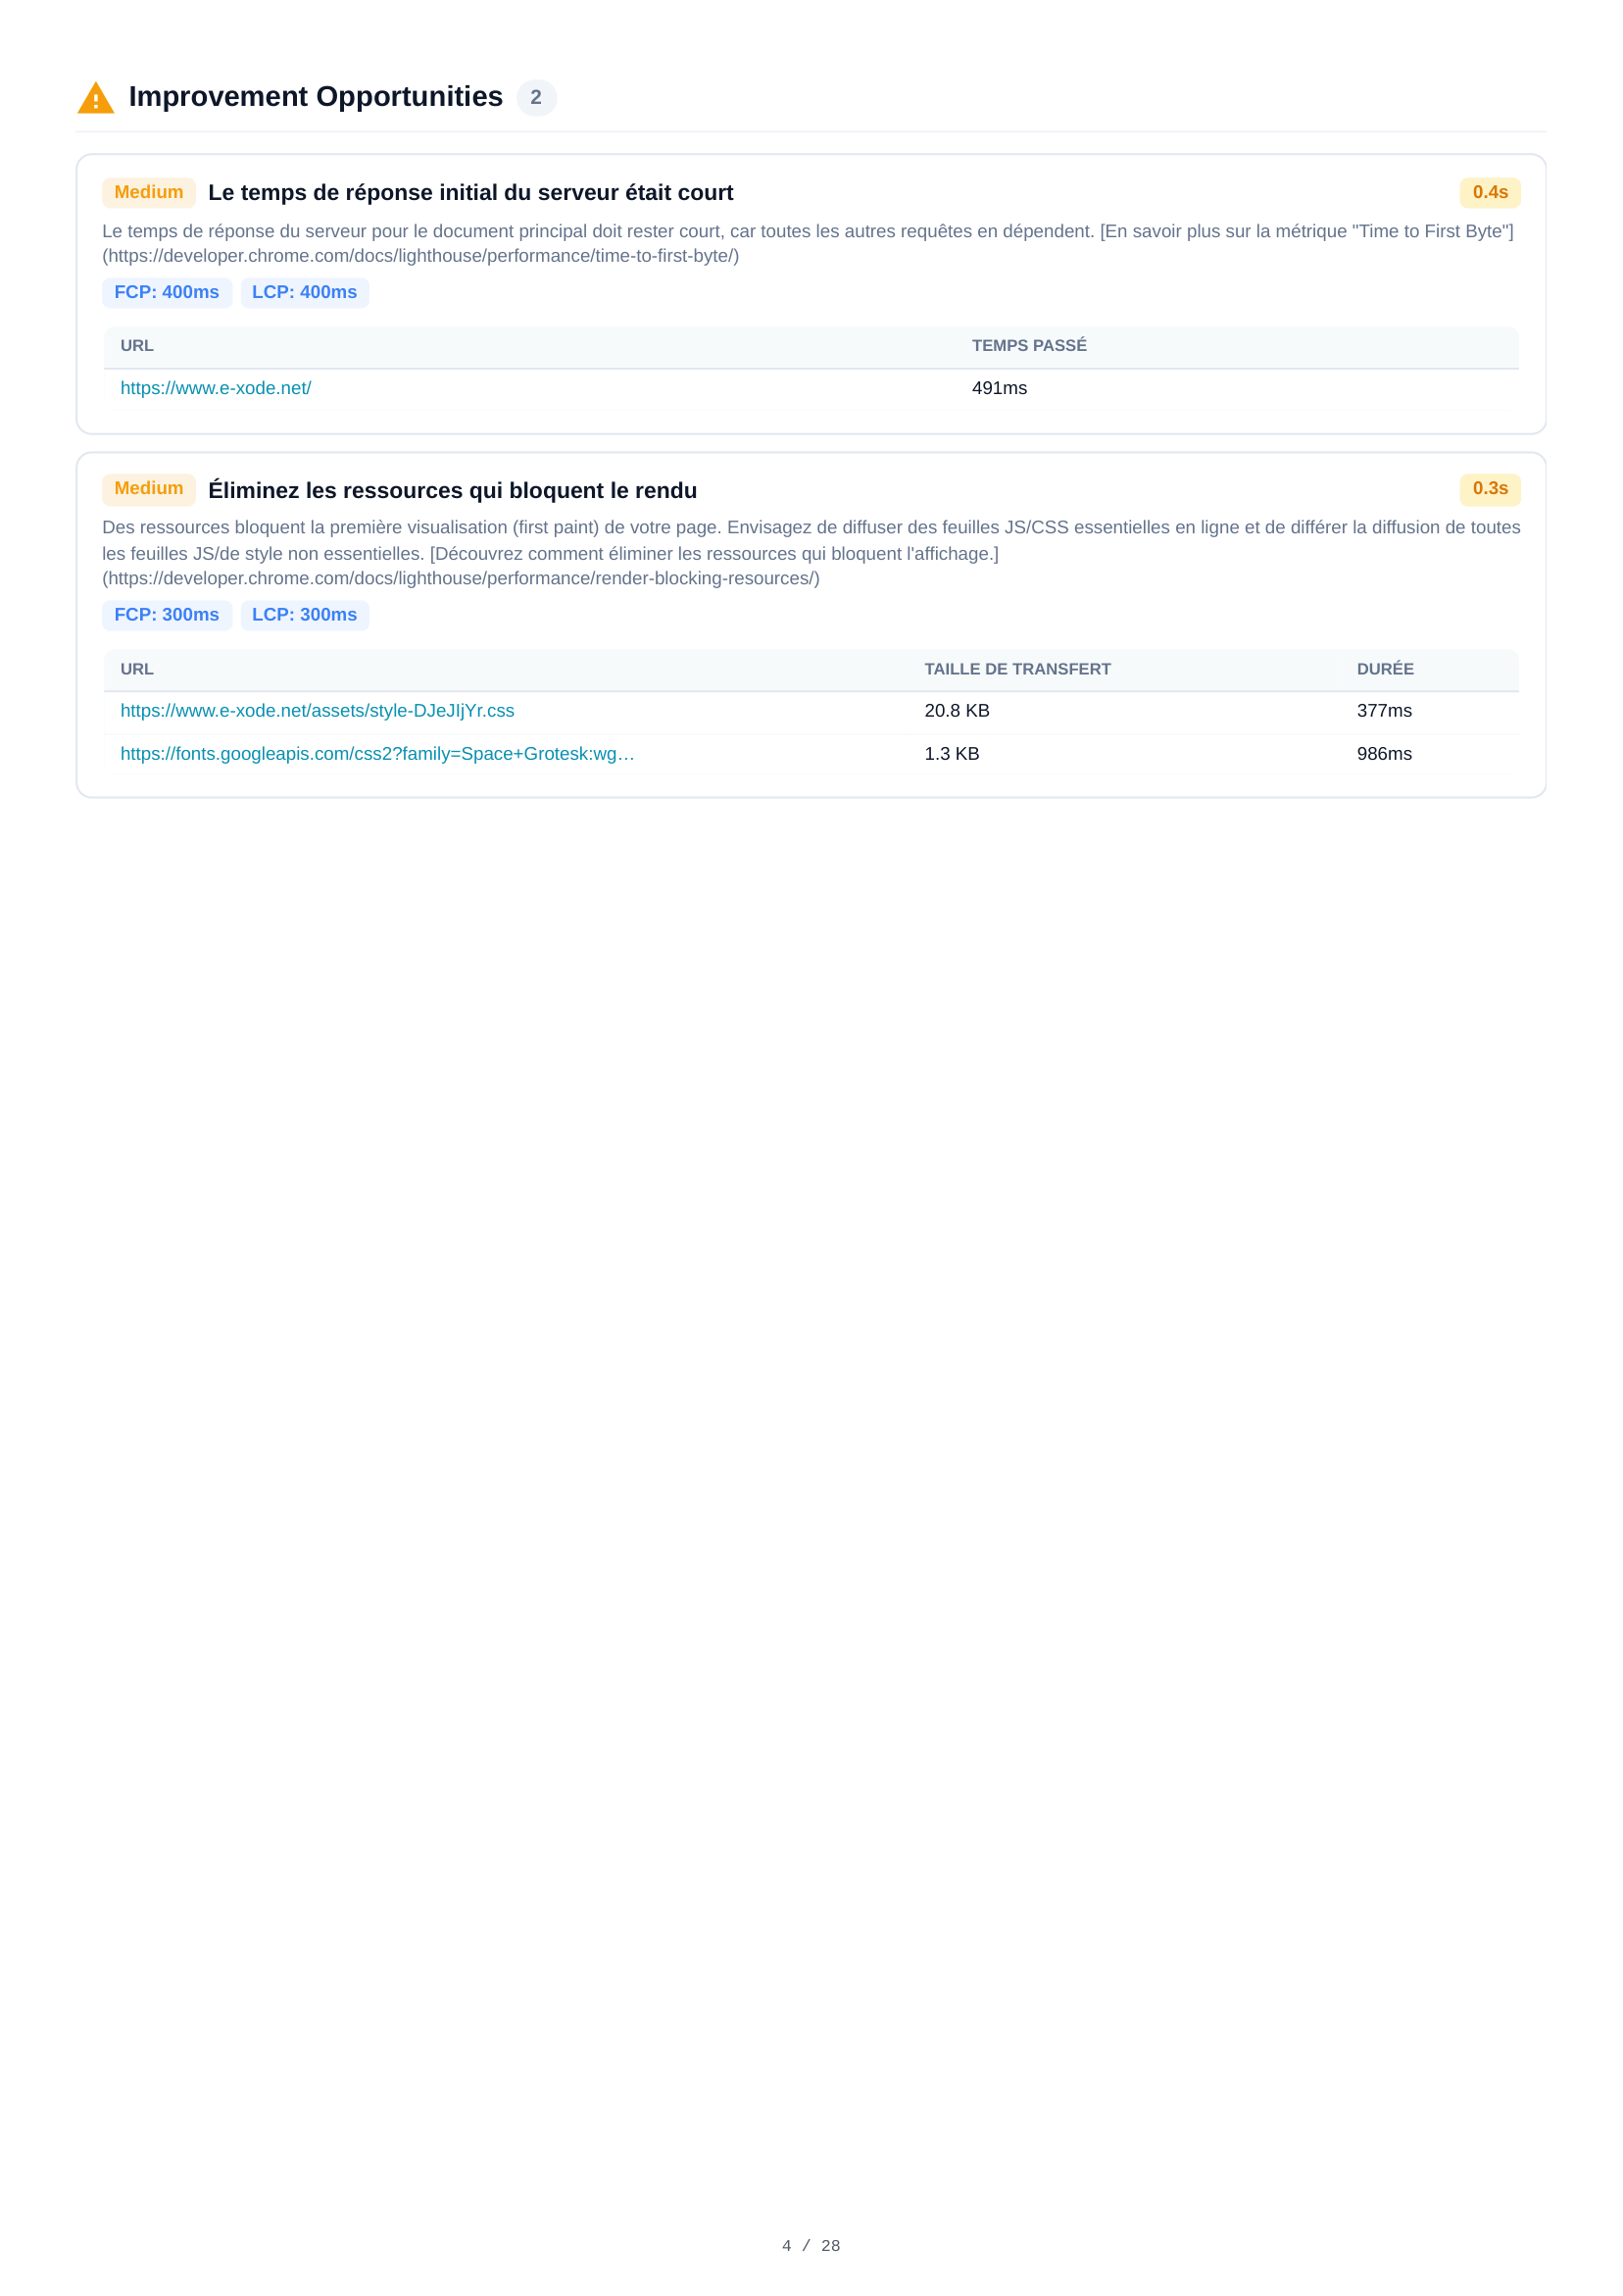
Two improvement opportunities are identified for mobile. Each includes a severity level, description, and estimated time savings. Key findings include server response time analysis and recommendations for optimizing resource delivery to improve loading performance.
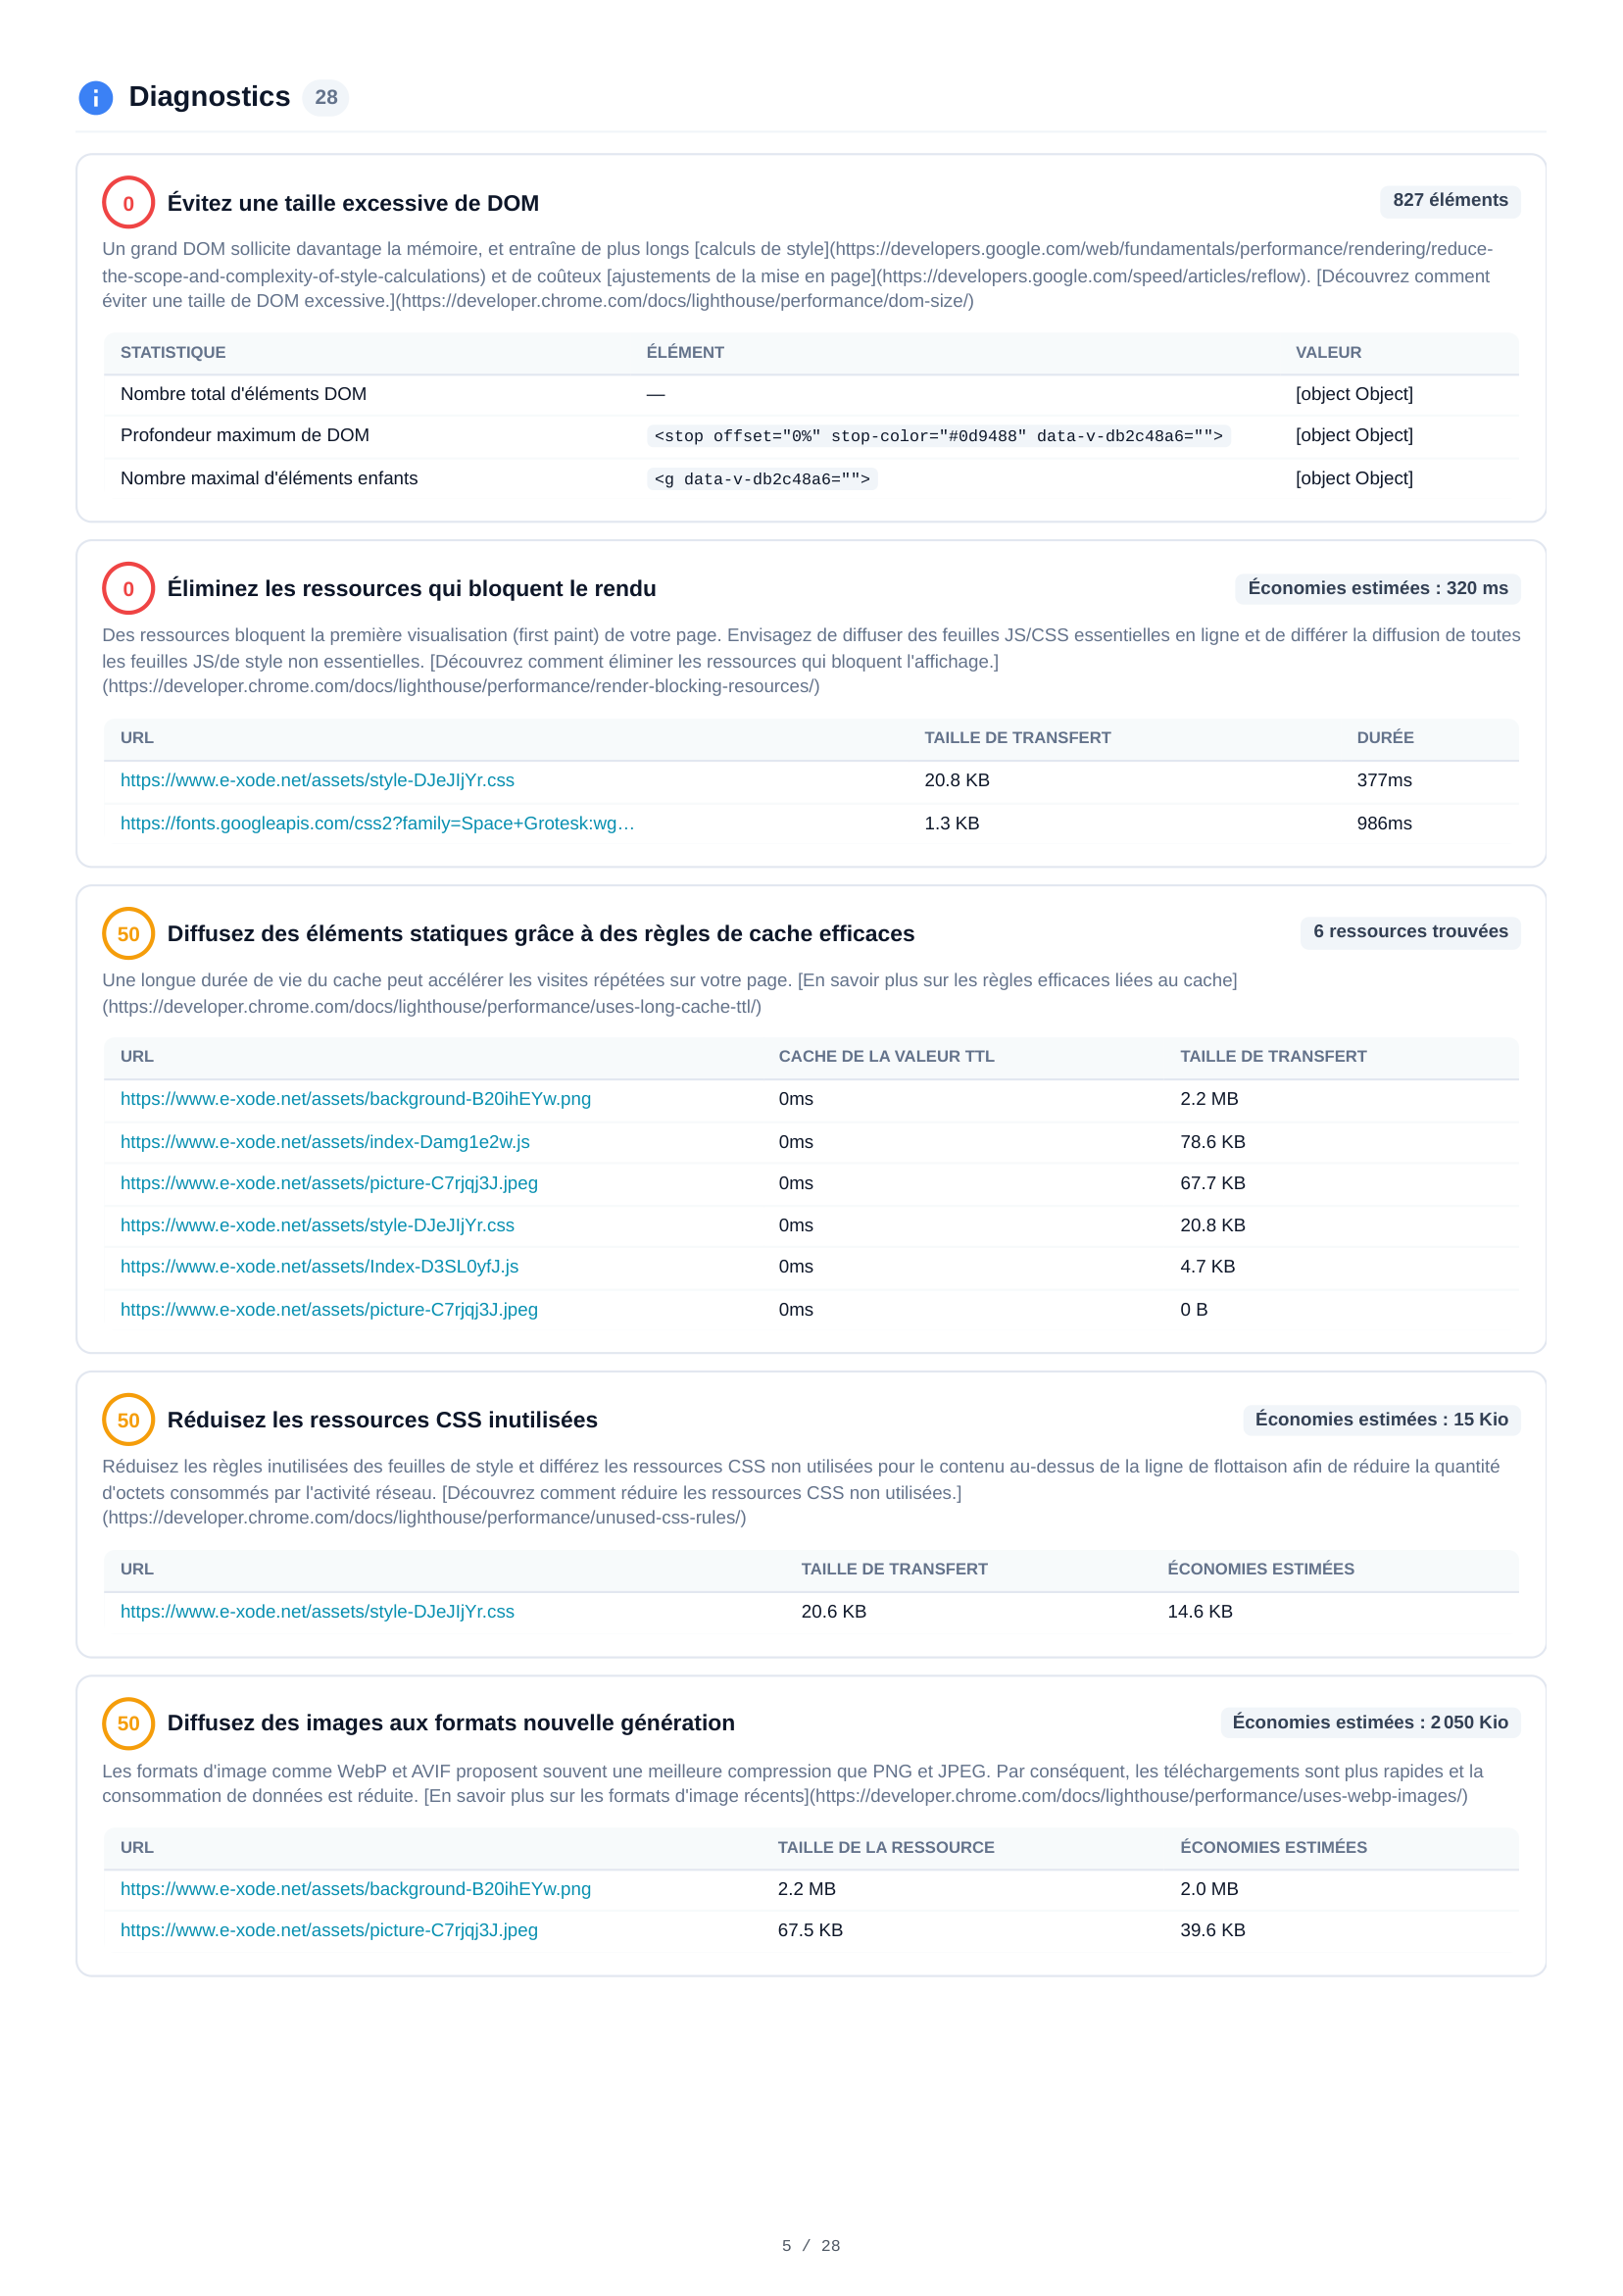

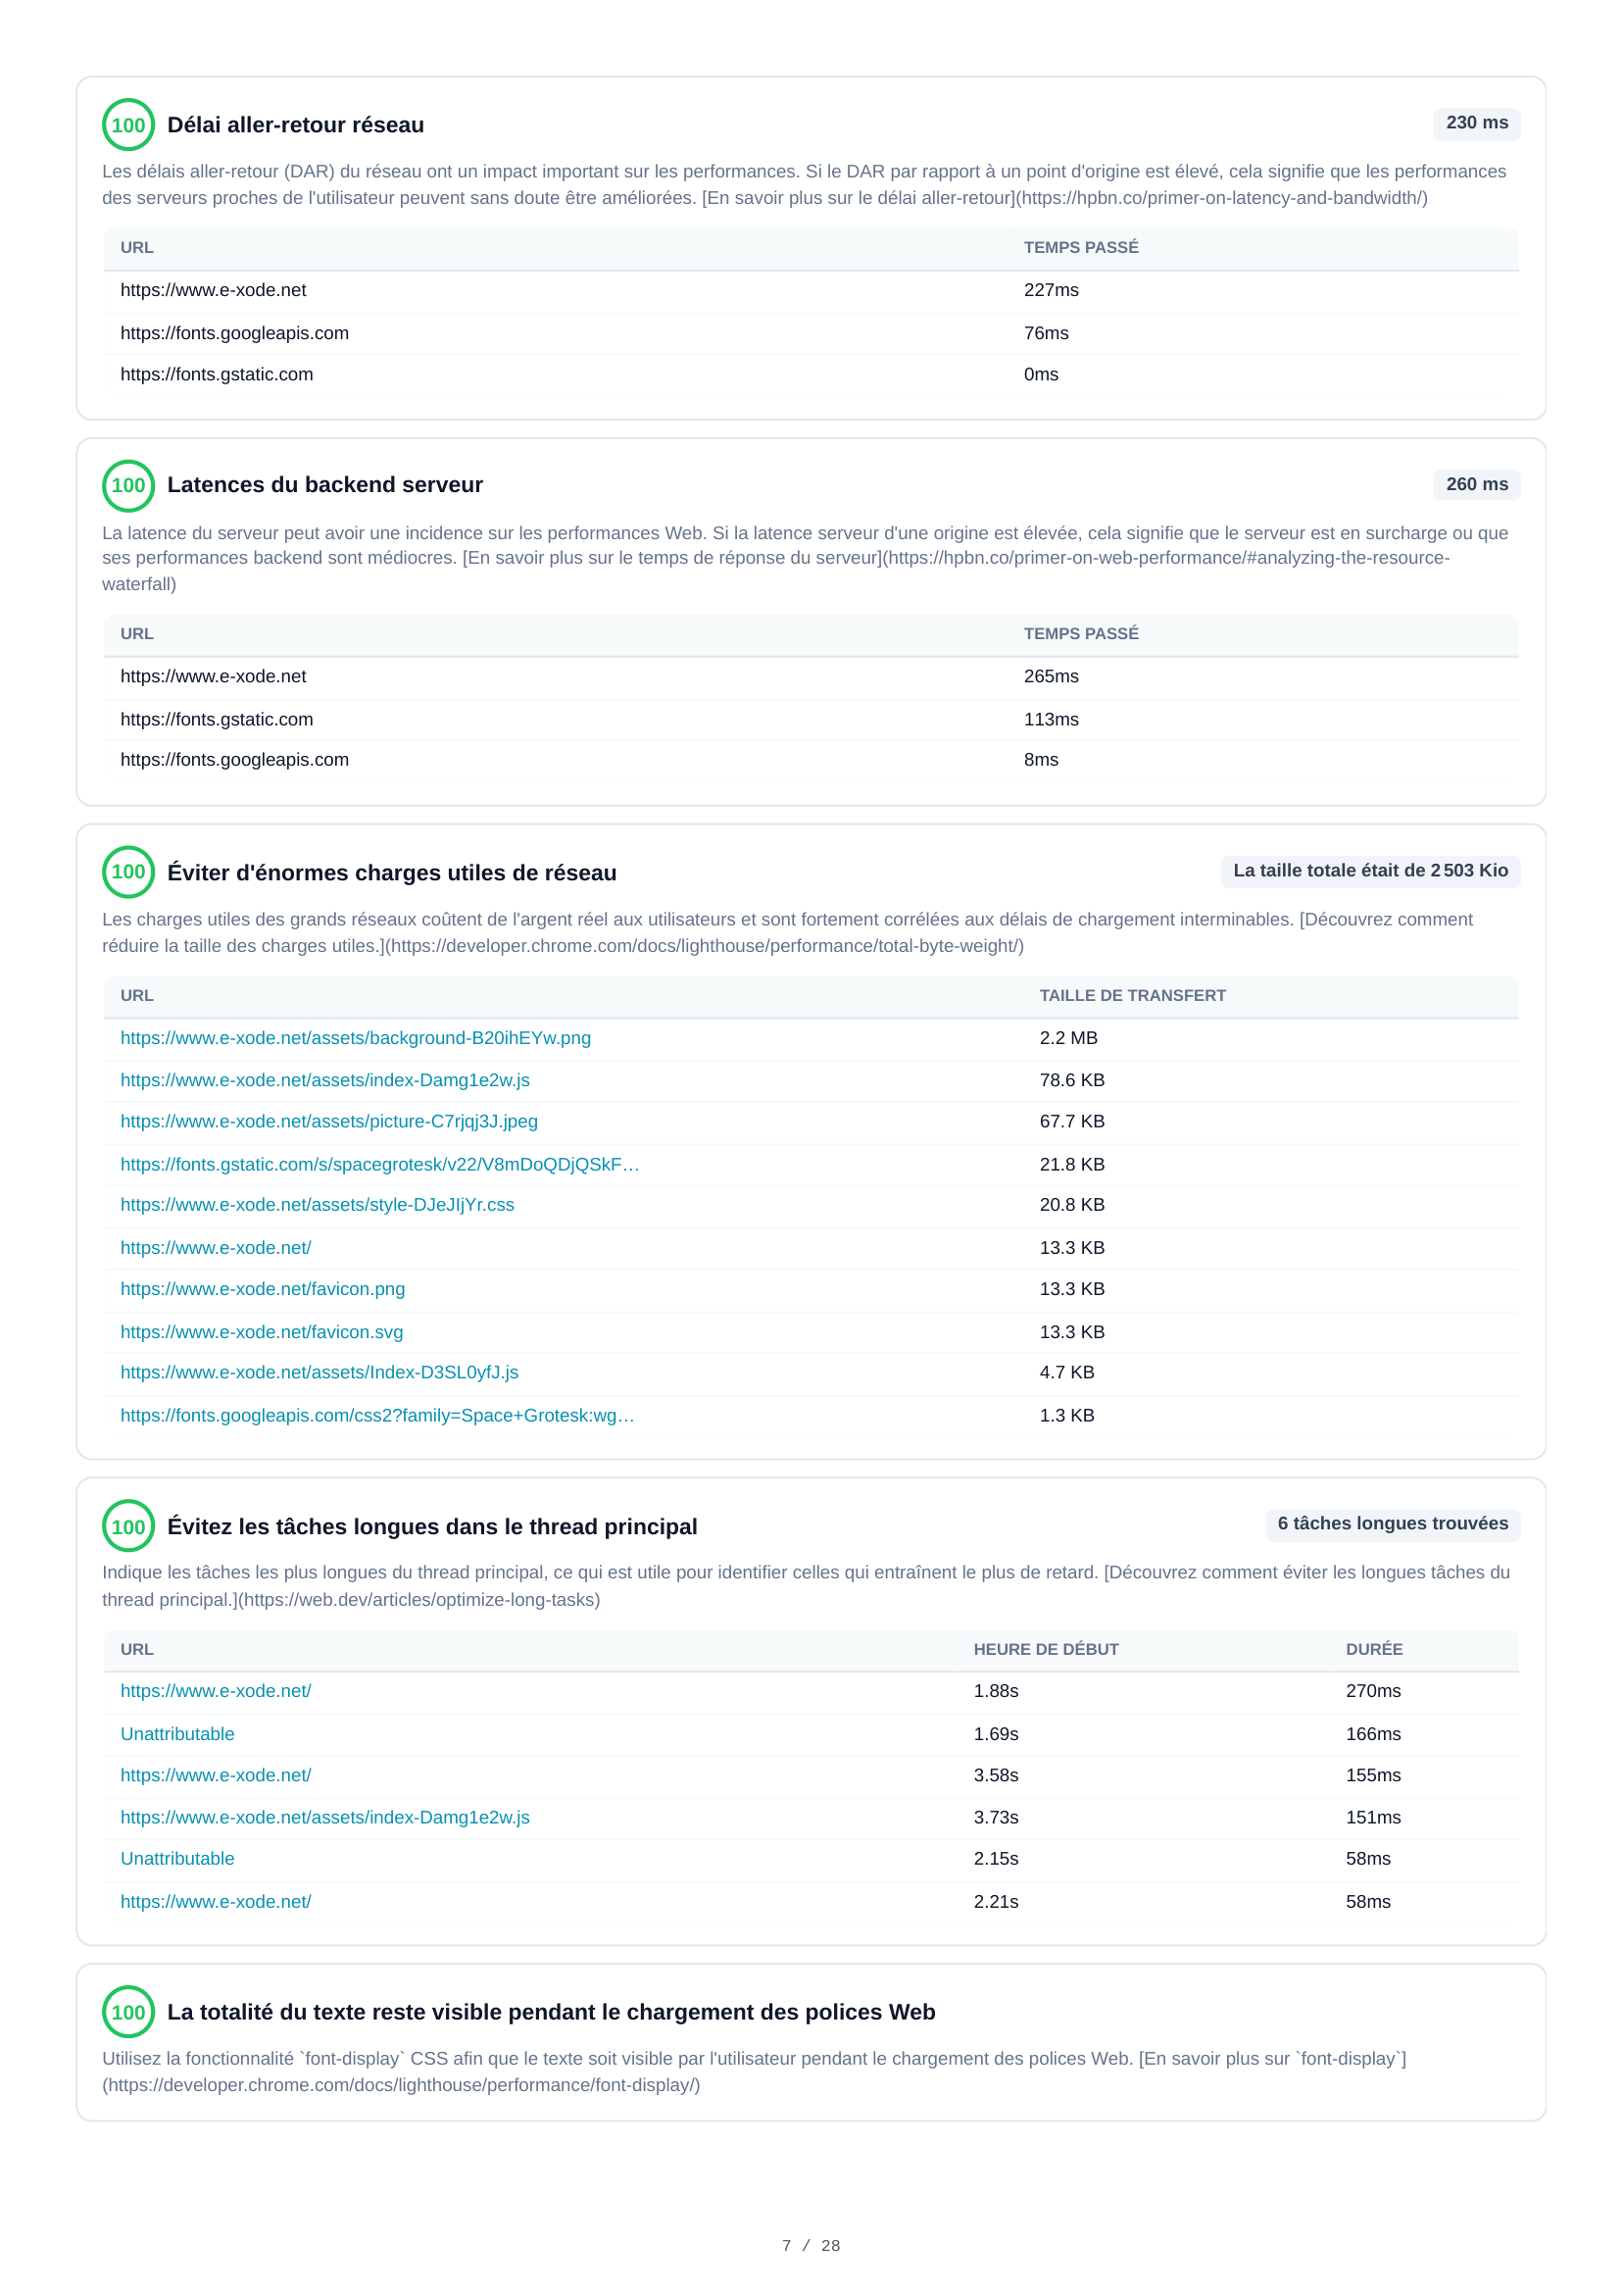
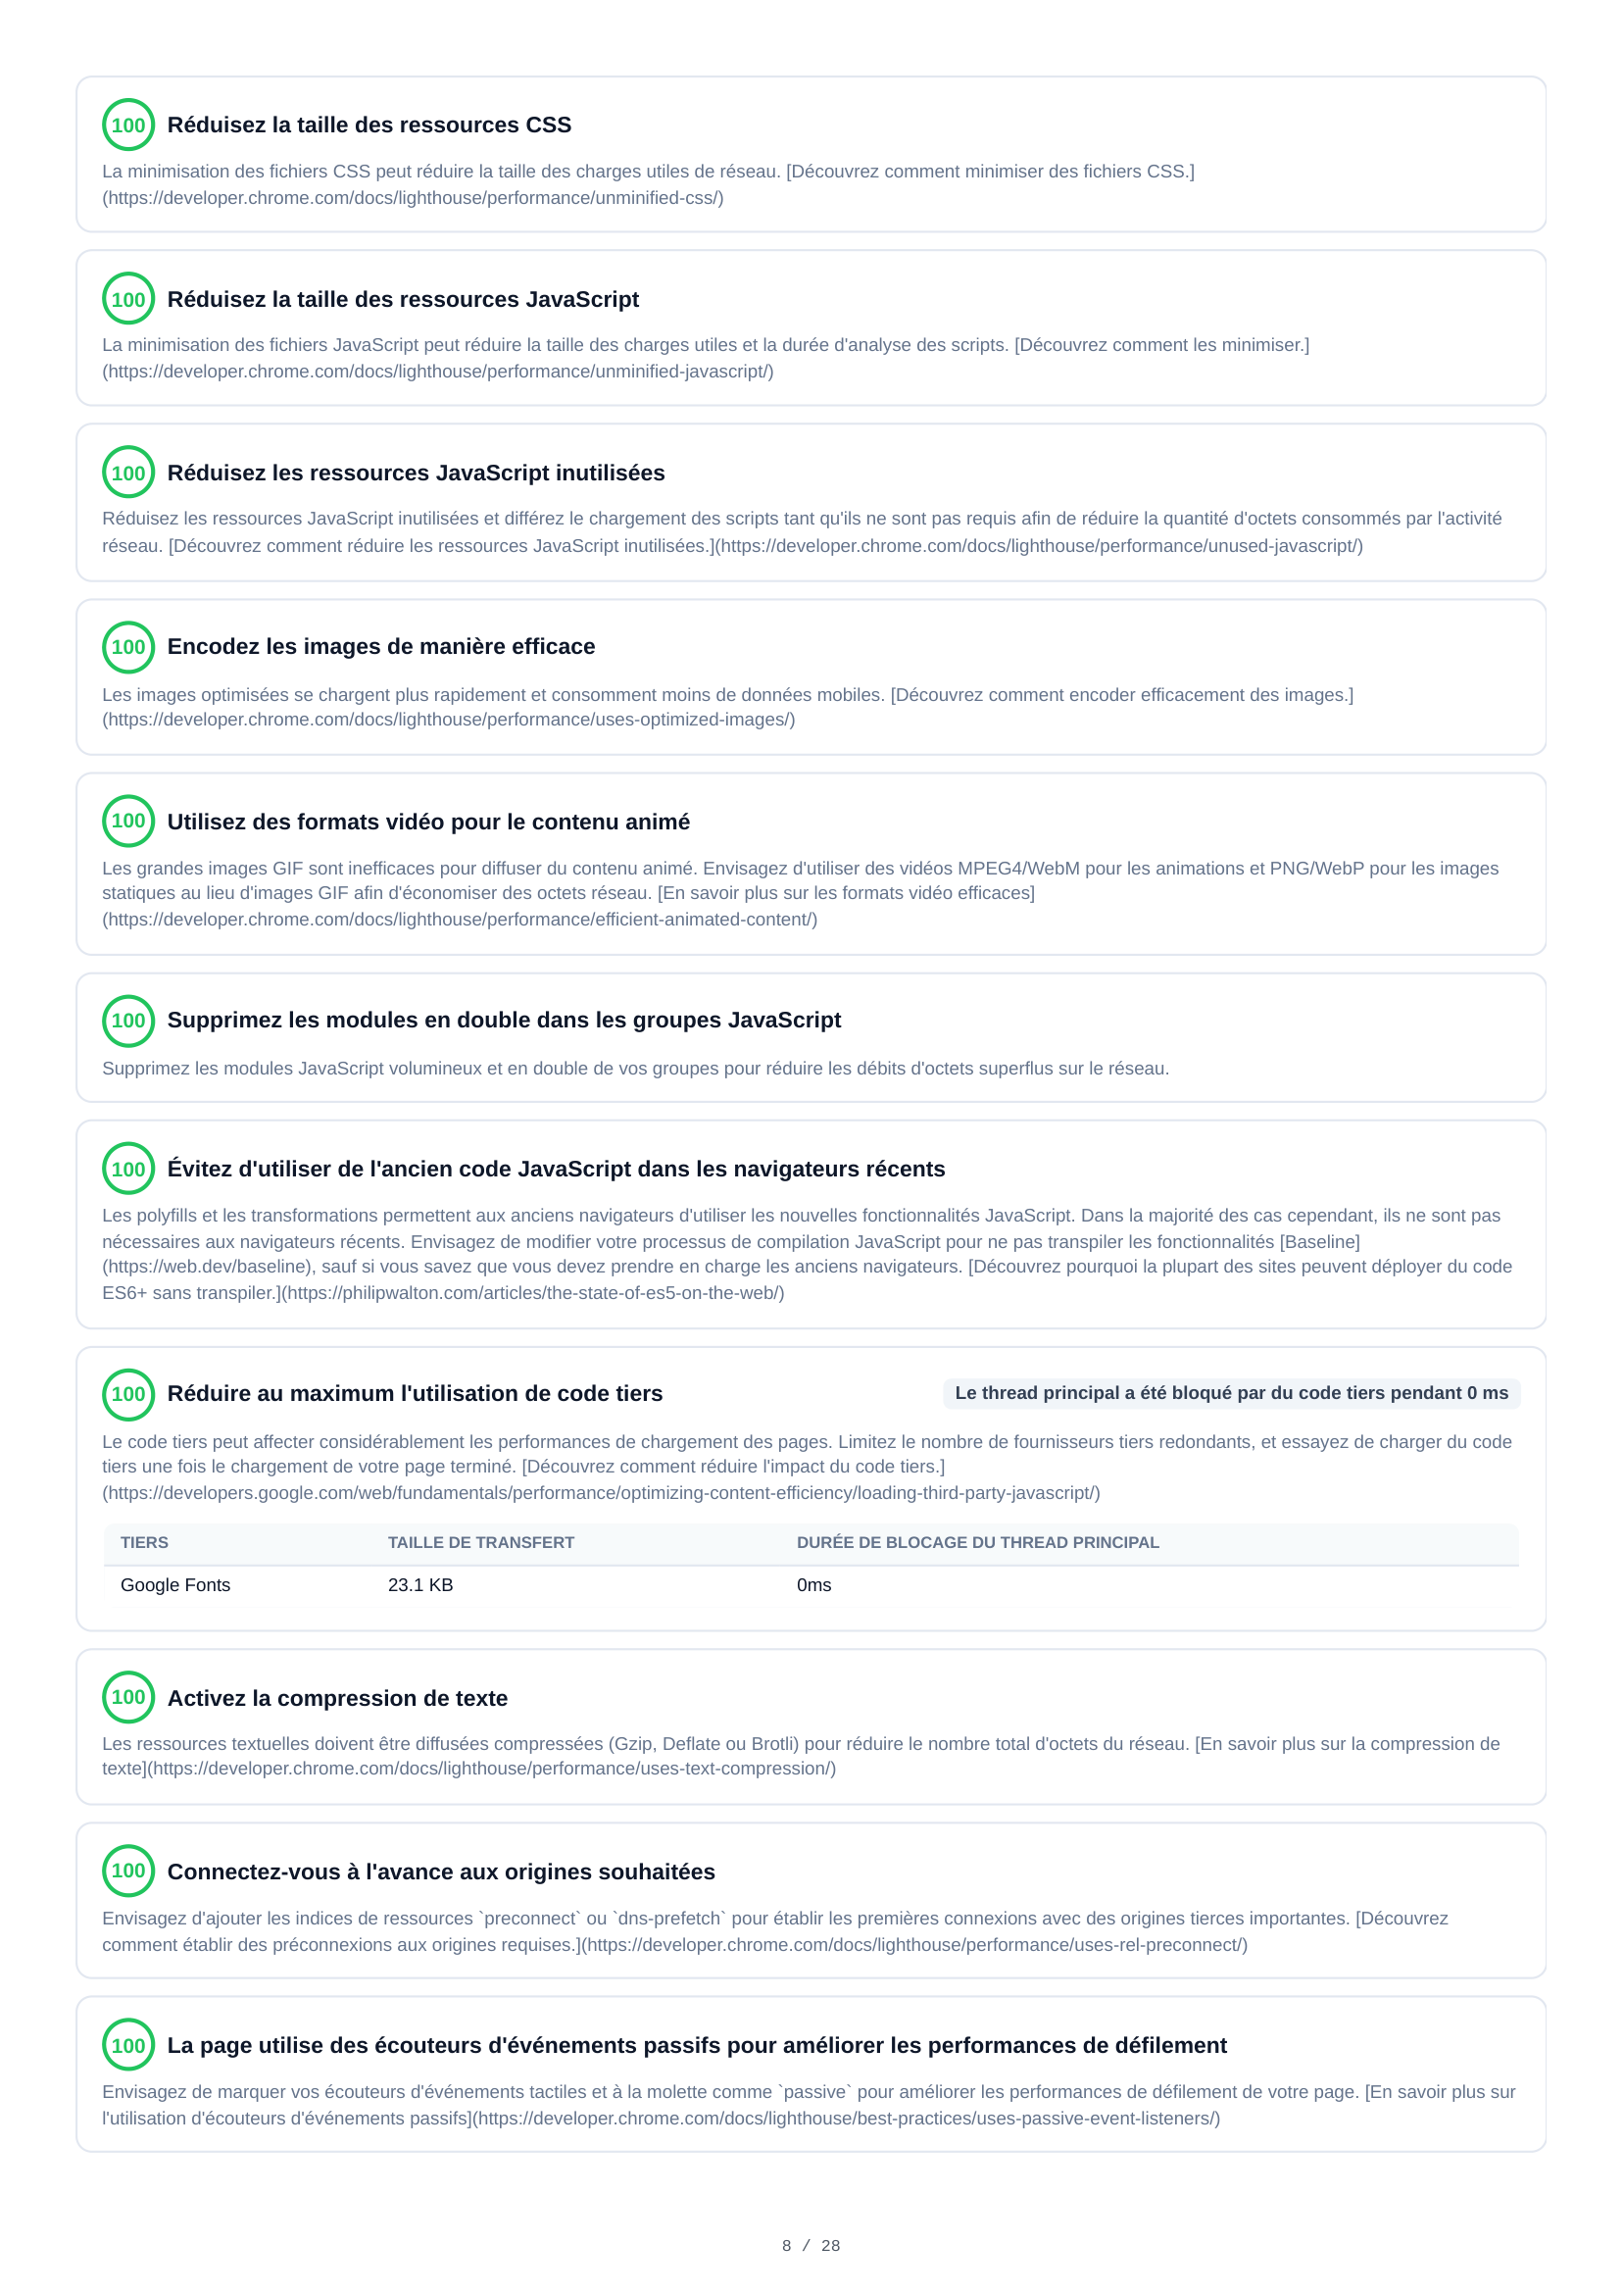
Mobile Diagnostics
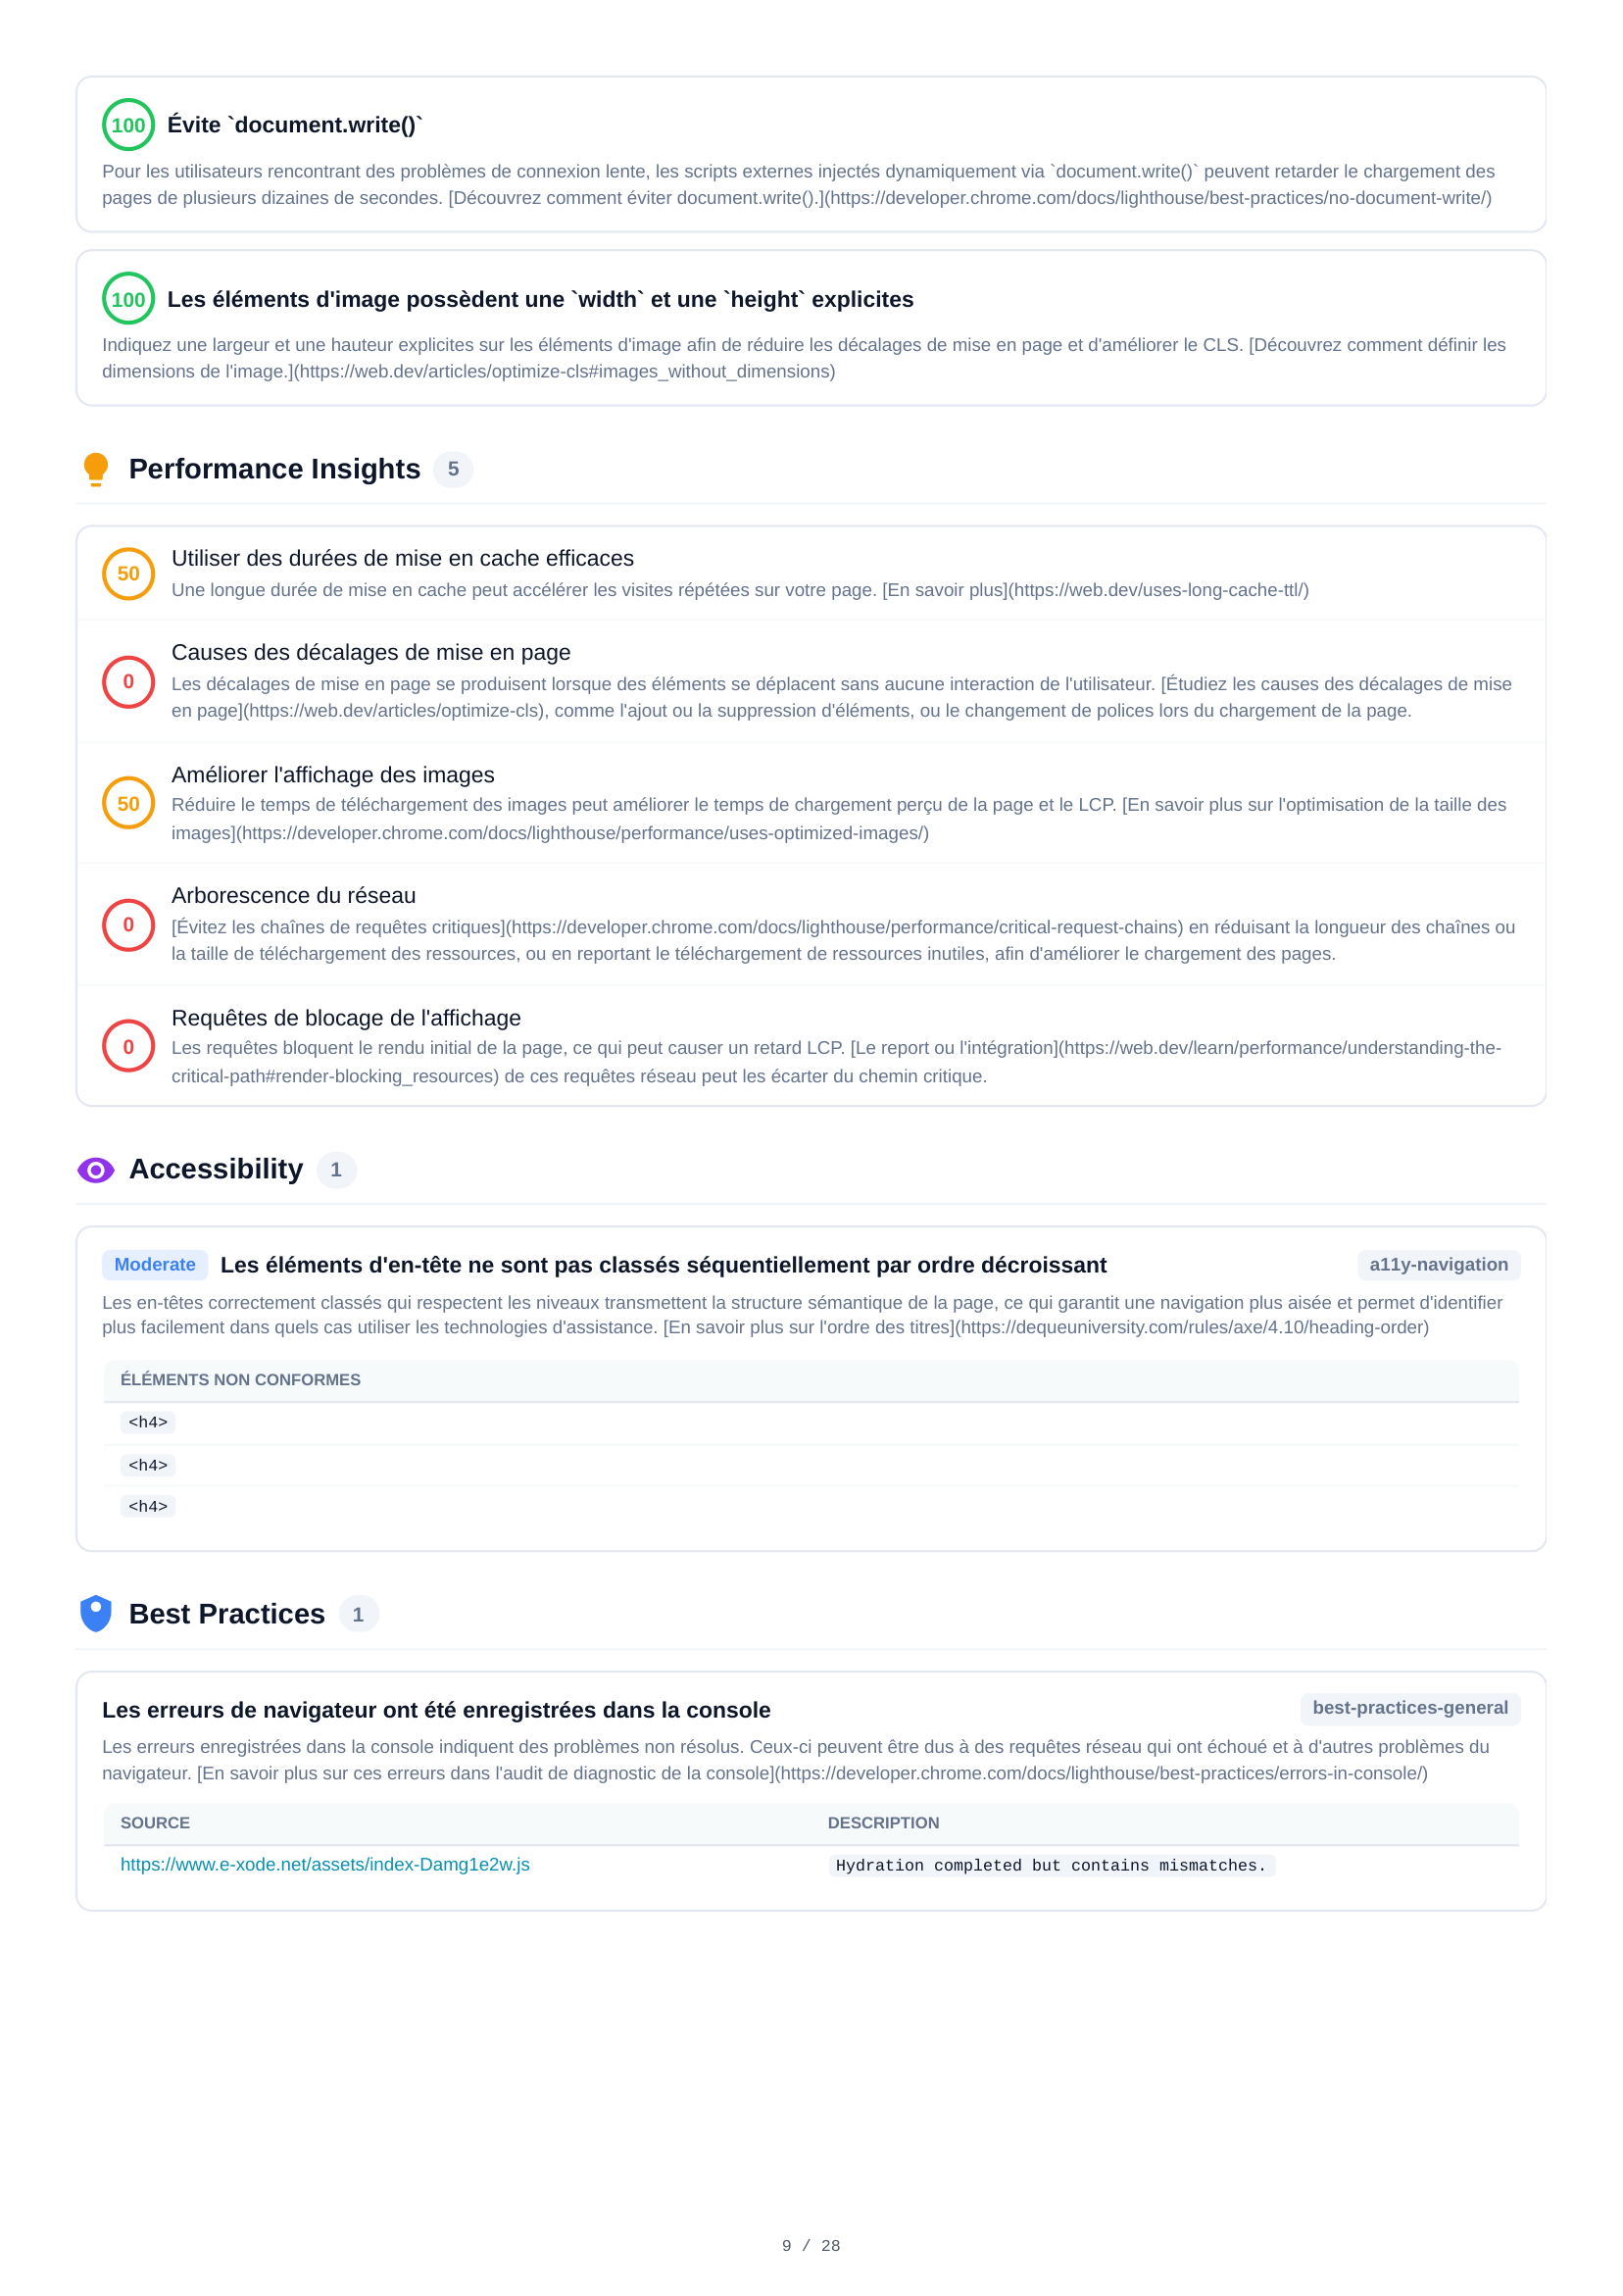
28 diagnostic audits span 5 pages, providing in-depth mobile performance analysis. Key findings include excessive DOM size (827 elements), image sizing issues, CSS and JavaScript optimization, network round-trip delays, render-blocking resources, cache policy gaps, and detailed audits covering every aspect of page performance.
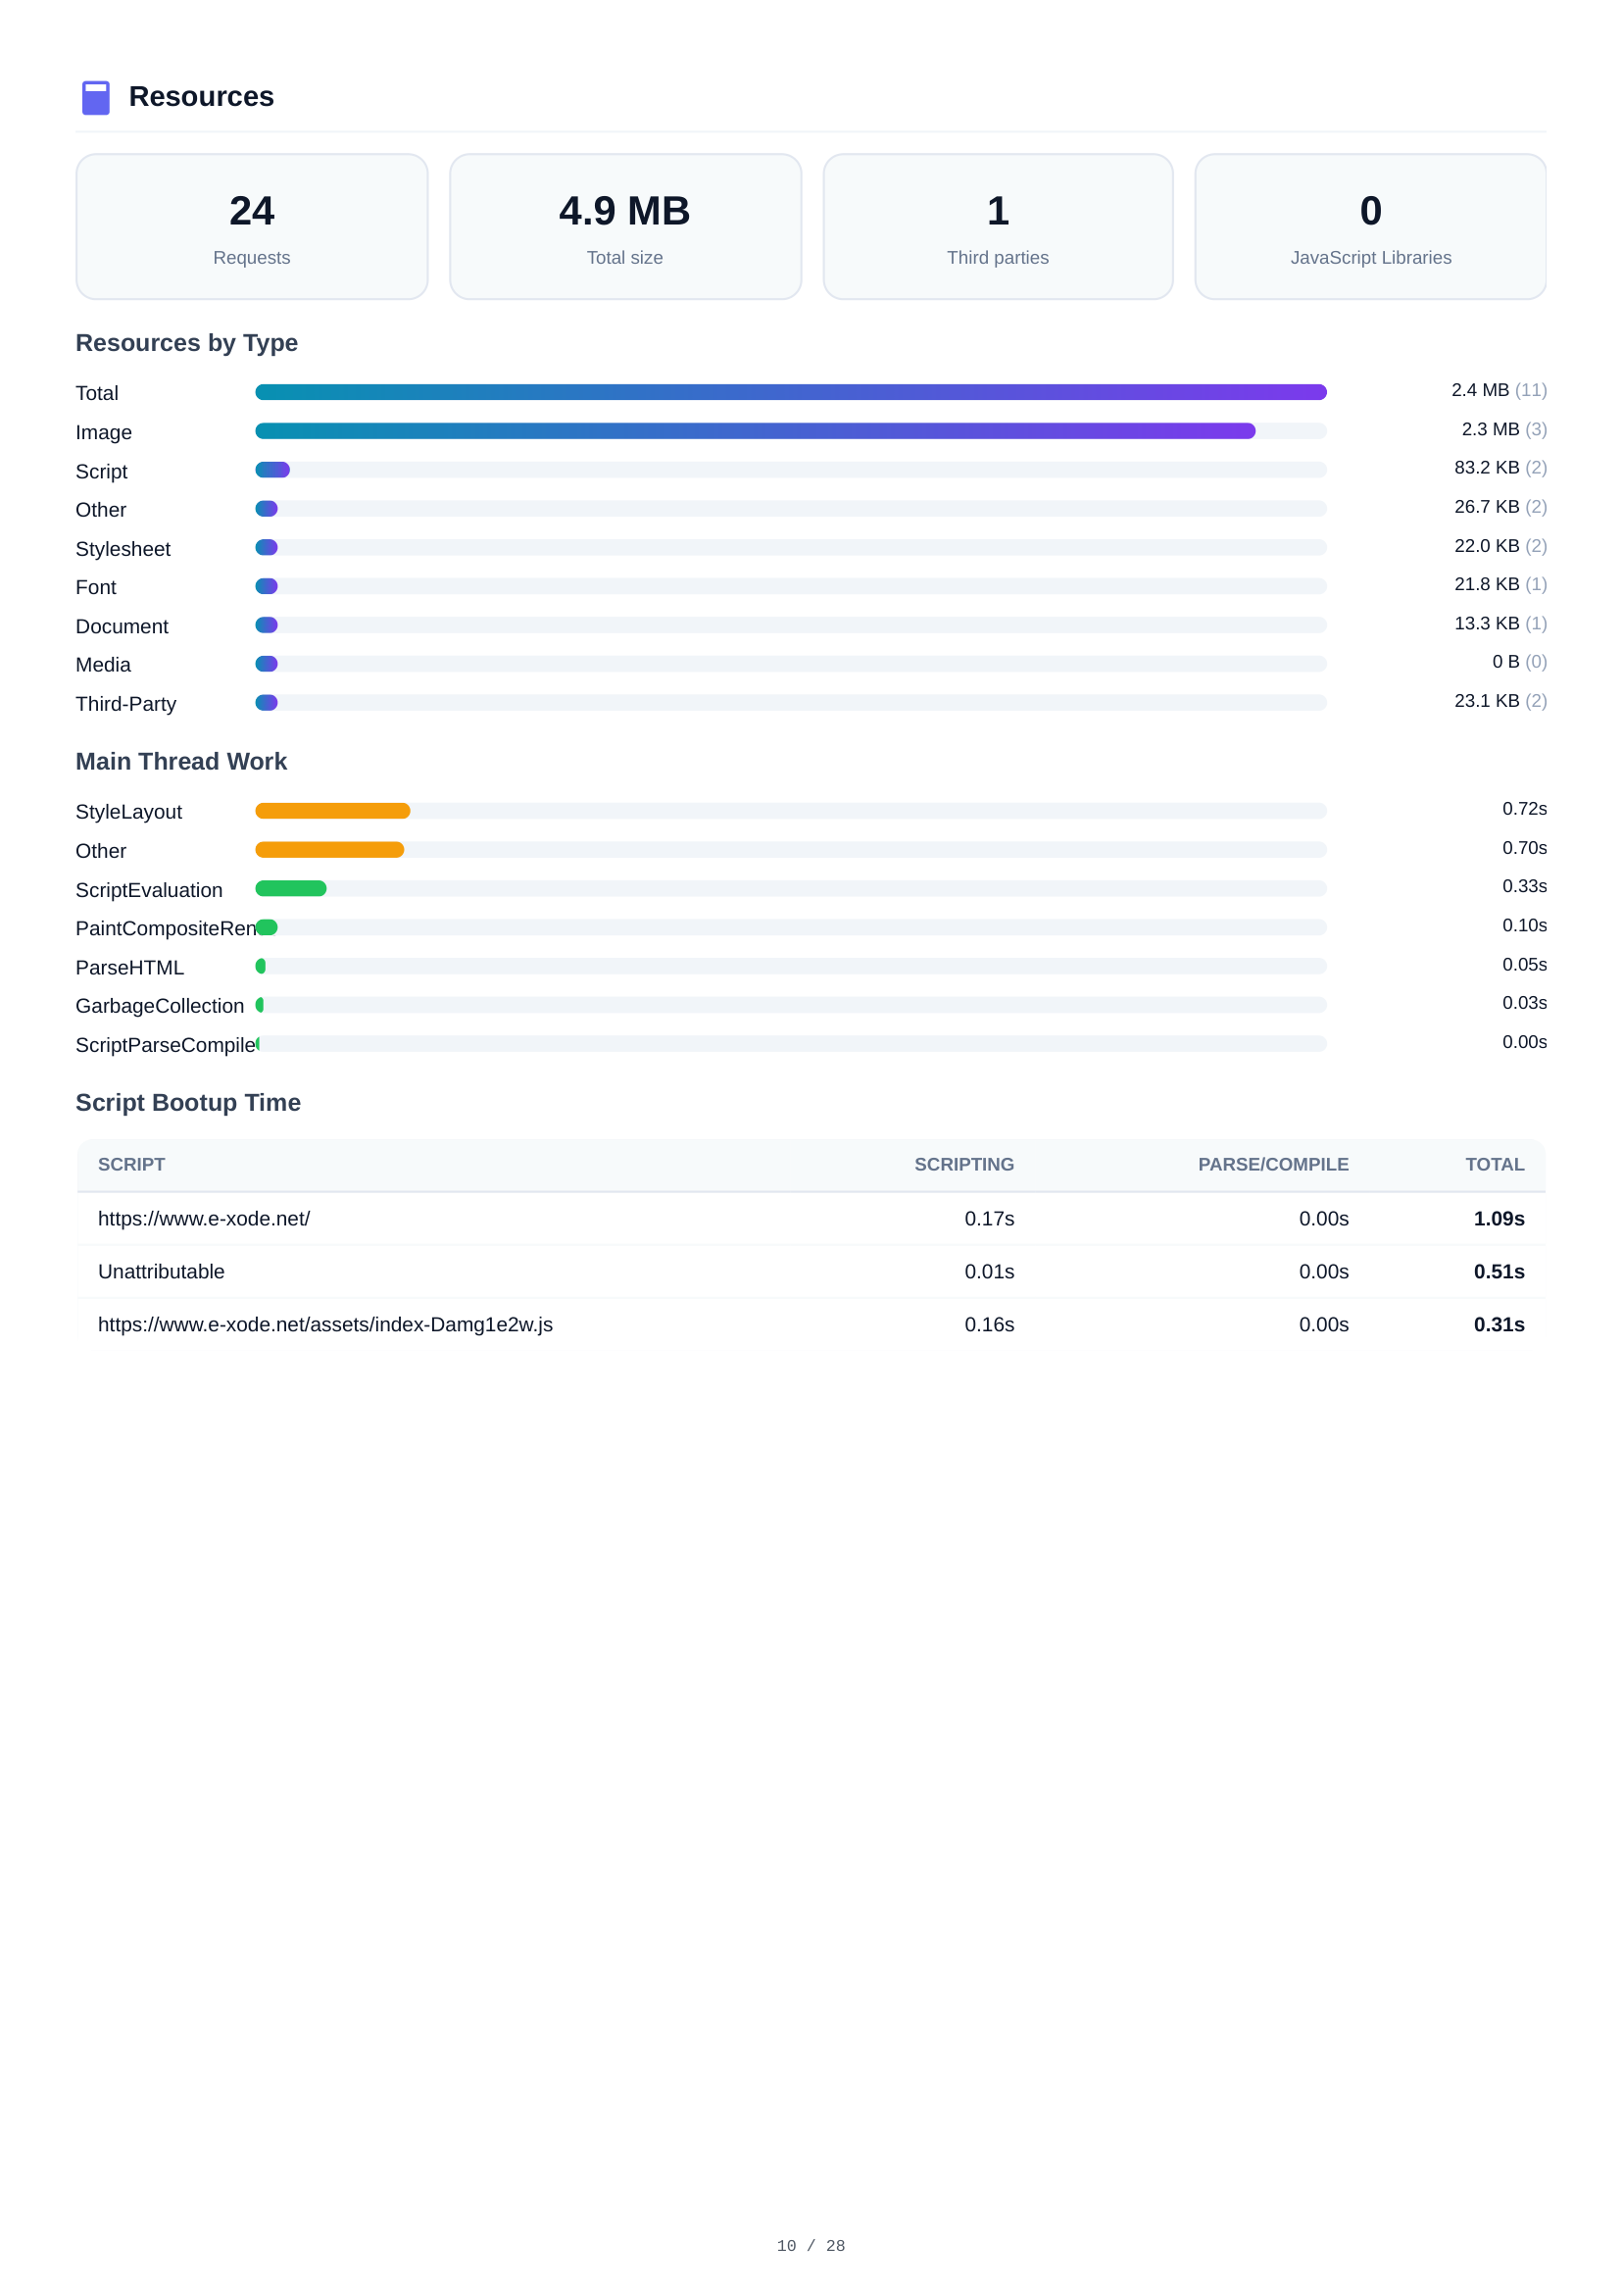
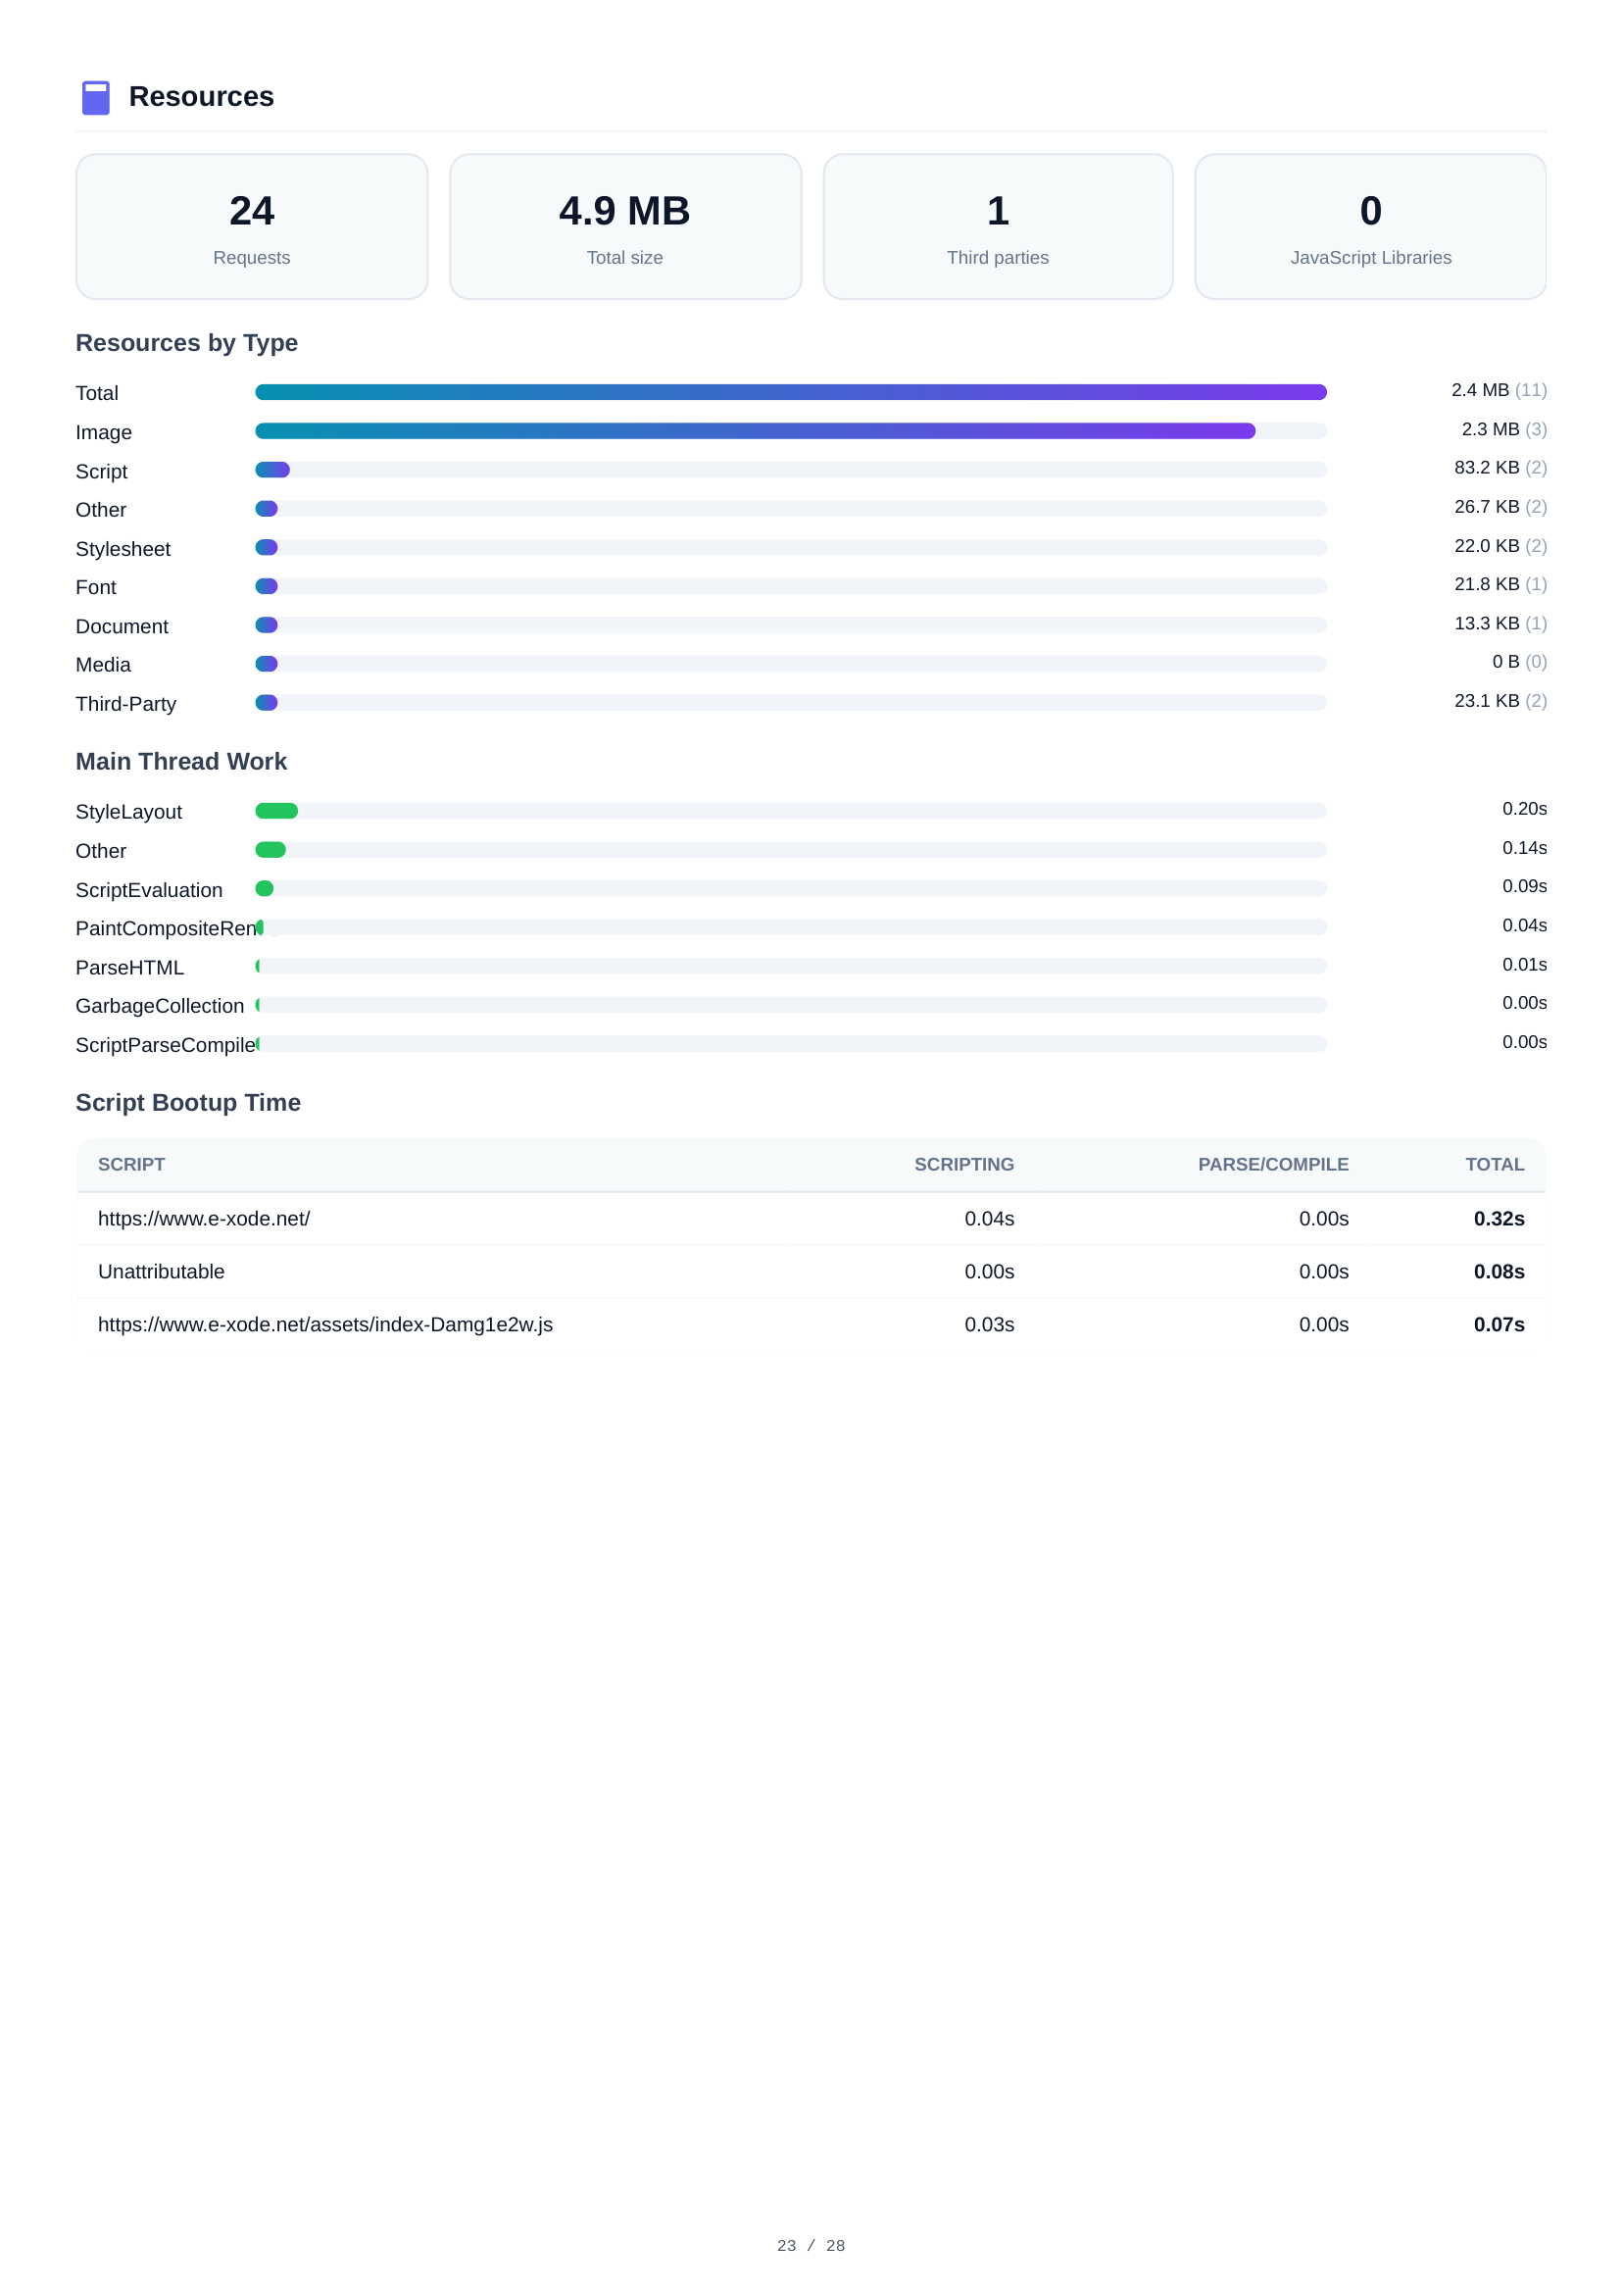
Mobile Resources
A complete resource inventory showing 24 requests totaling 4.9 MB. Breakdown by type: Images (2.4 MB, 11 files), Scripts (2.3 MB, 3 files), Other (83.2 KB), Stylesheets (26.7 KB), and Fonts (22.0 KB). Third-party analysis identifies external dependencies.
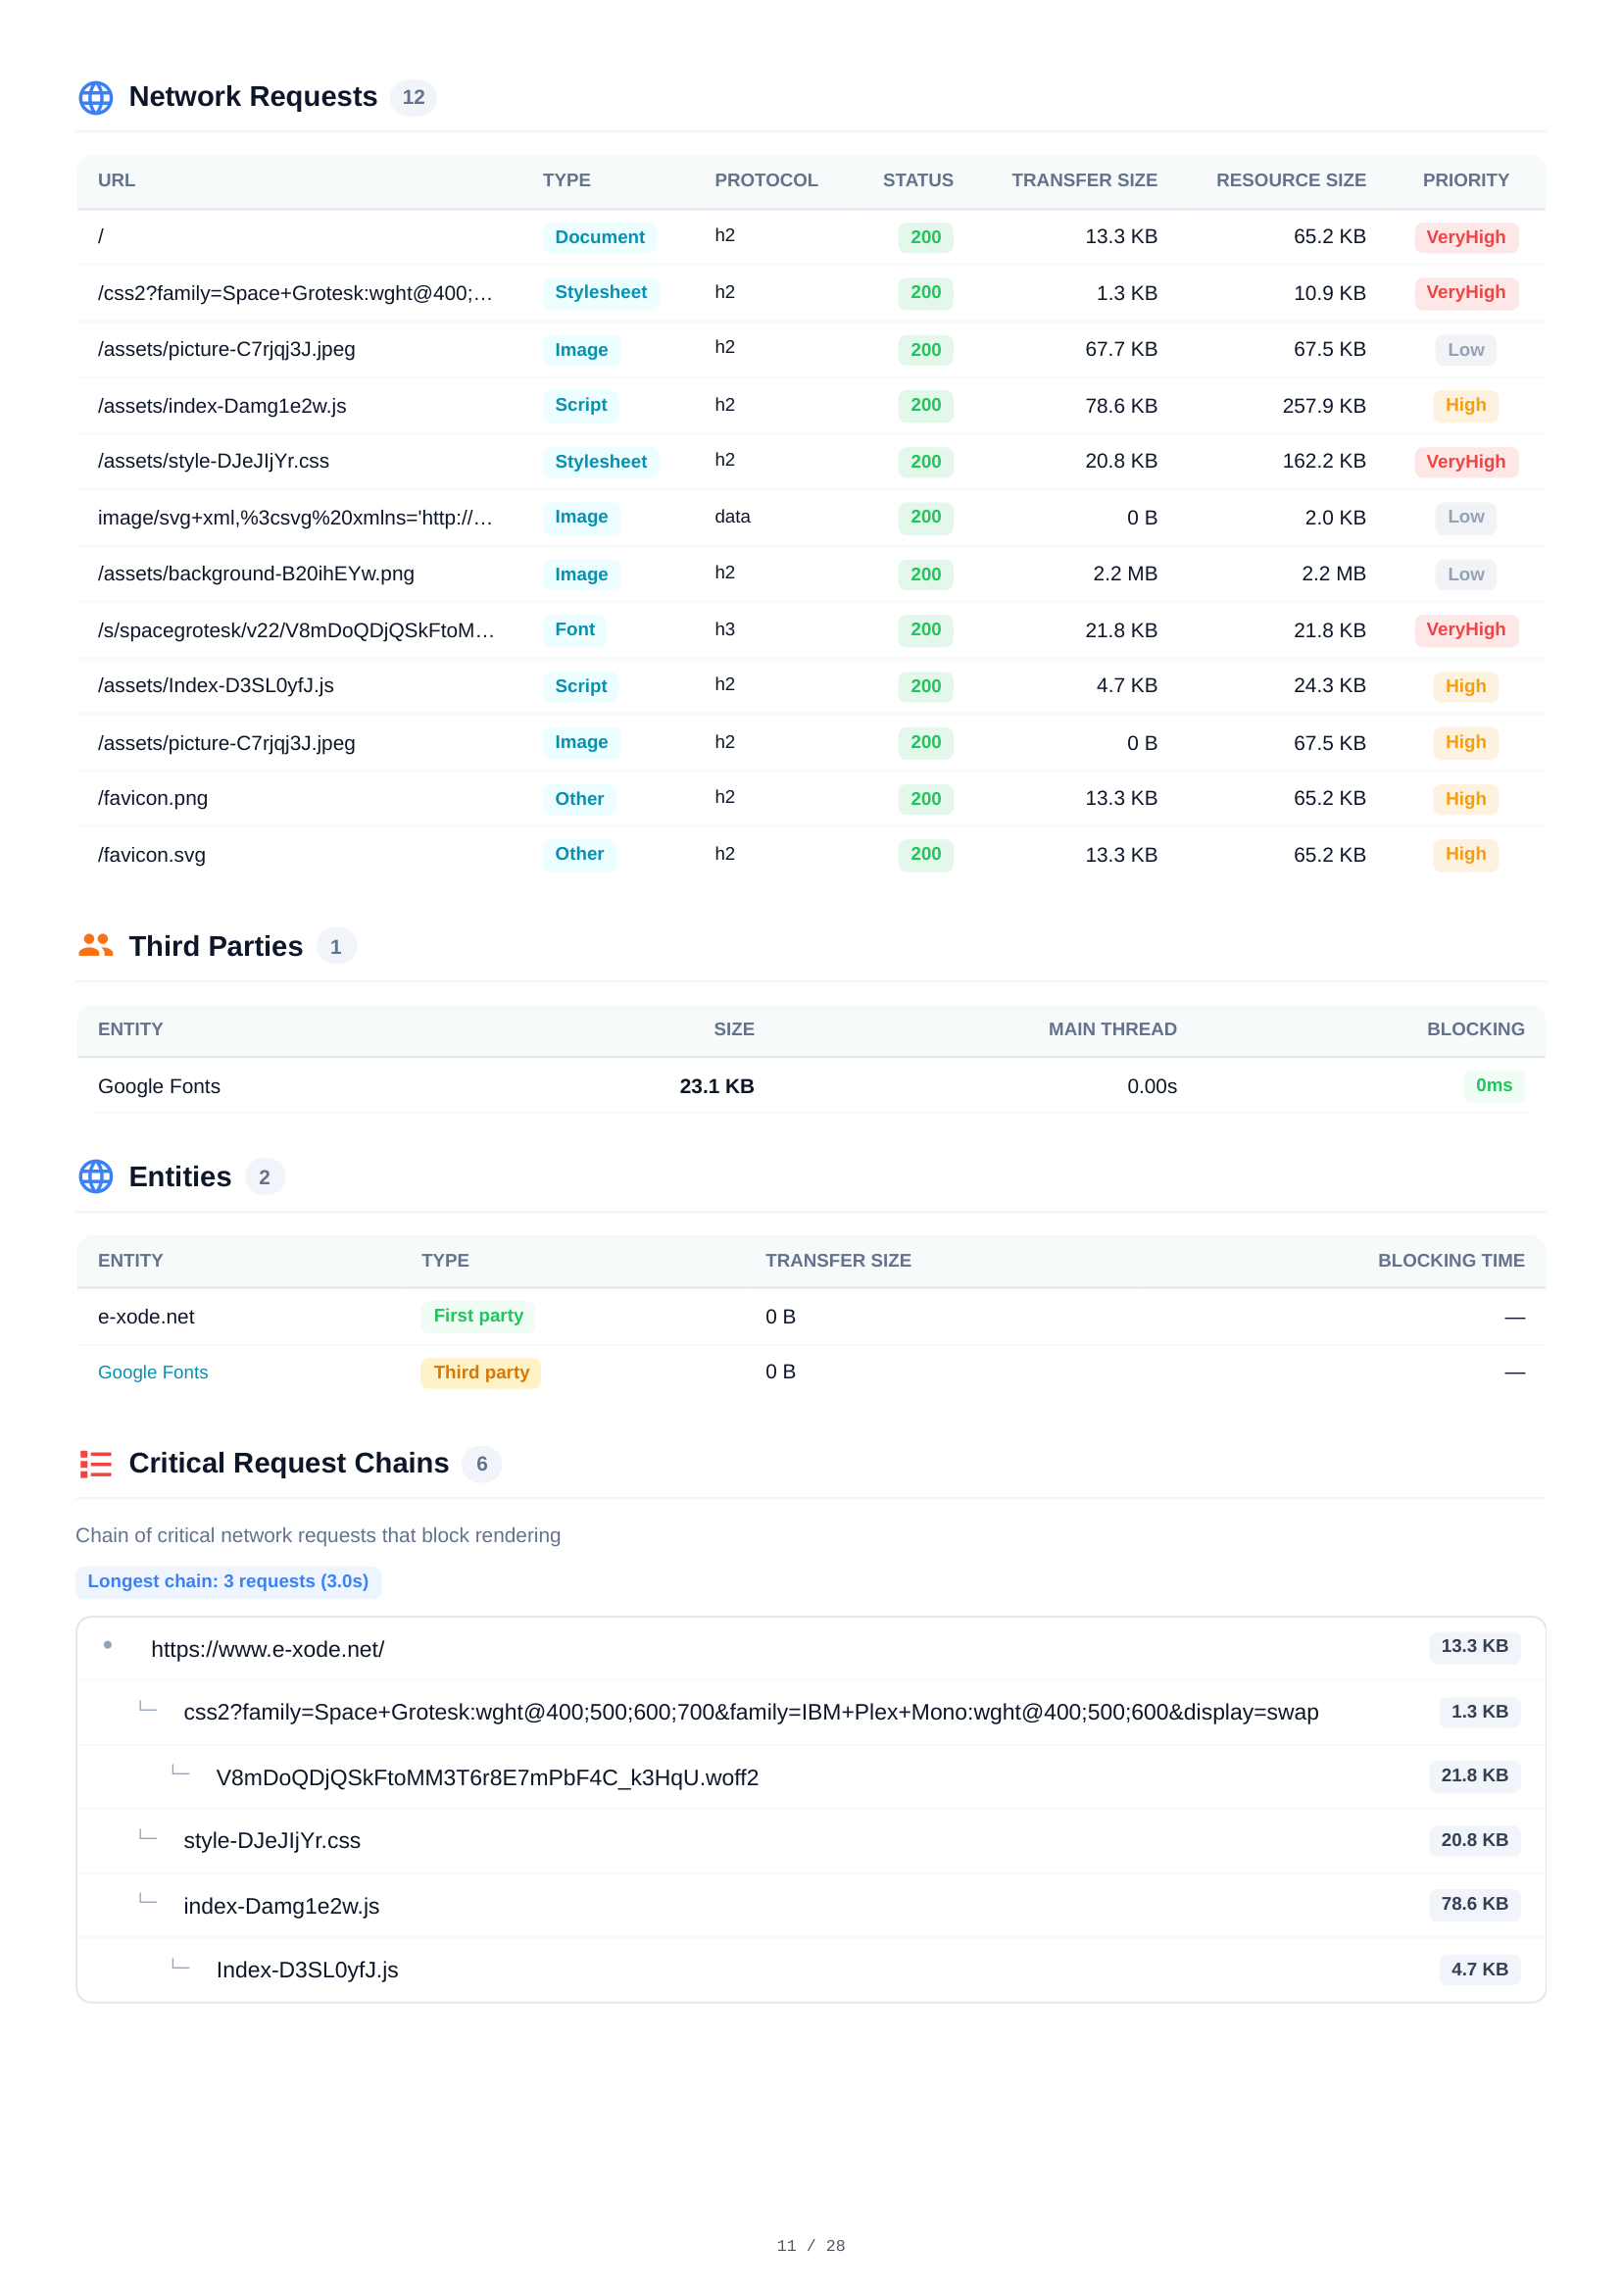
Mobile Network Requests
A detailed table of all 12 HTTP requests during mobile page load. Each request shows URL, resource type, protocol (h2), HTTP status, transfer size, resource size, and loading priority — providing full visibility into the network waterfall.
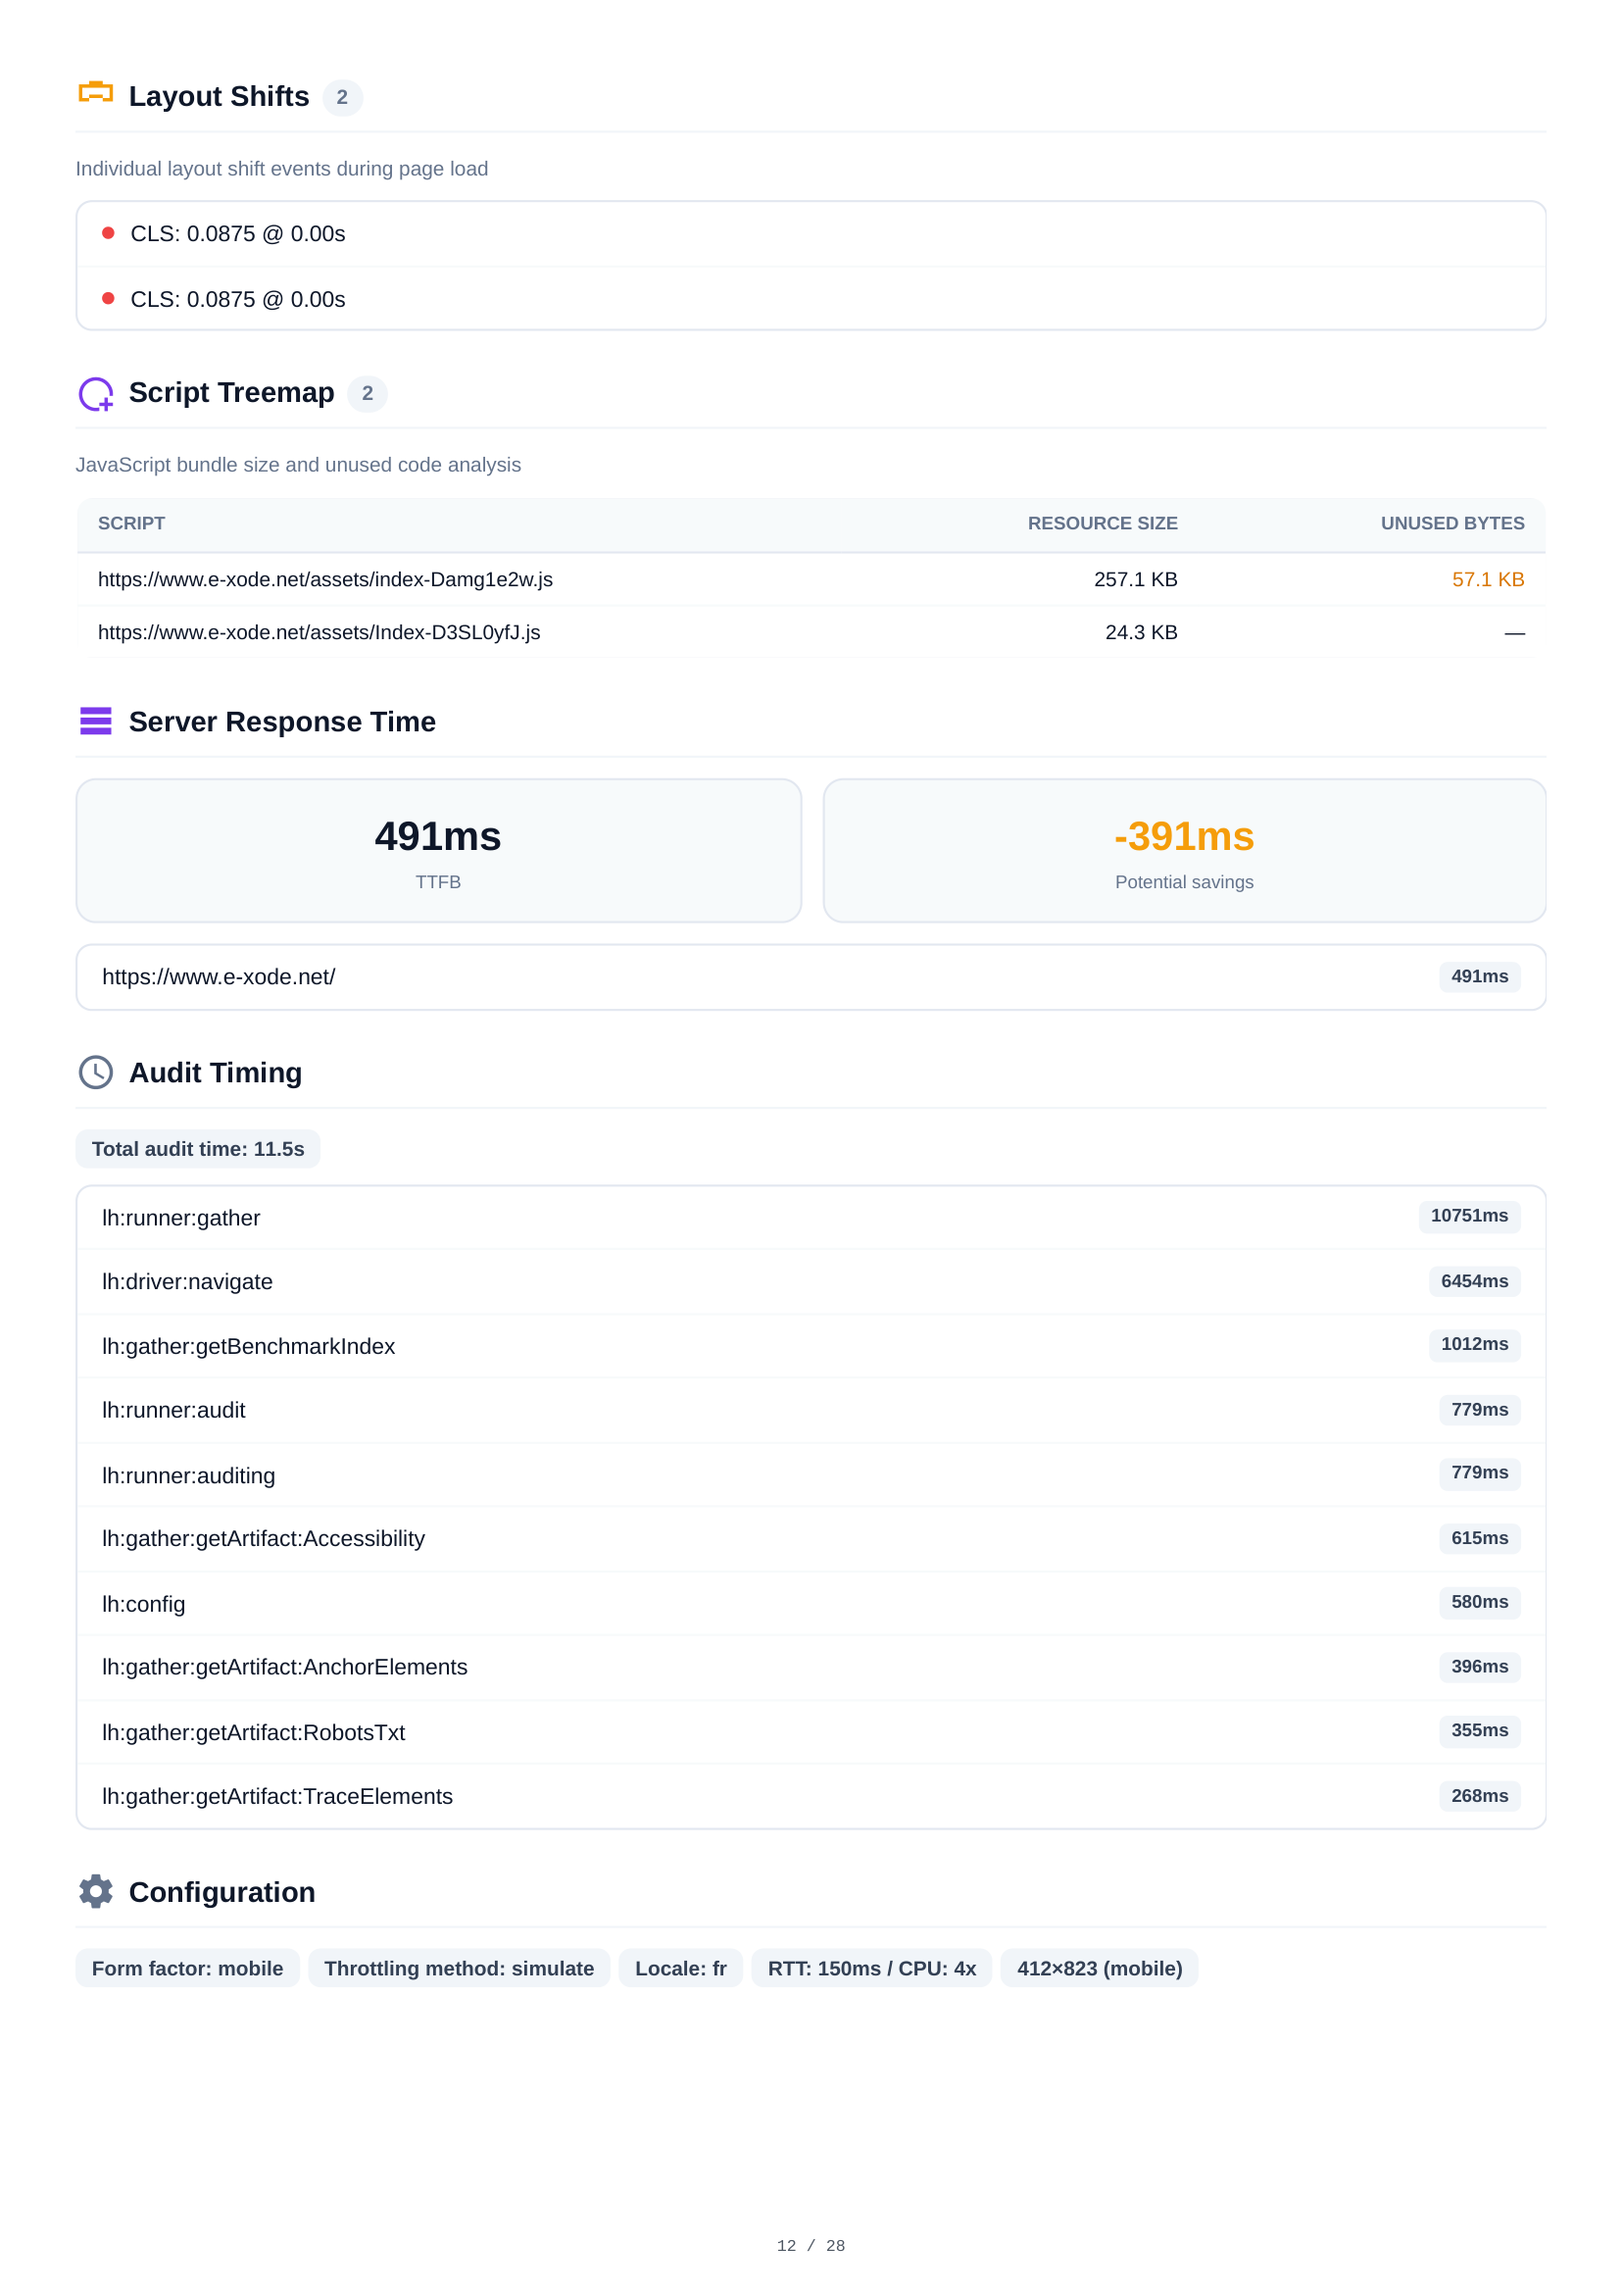

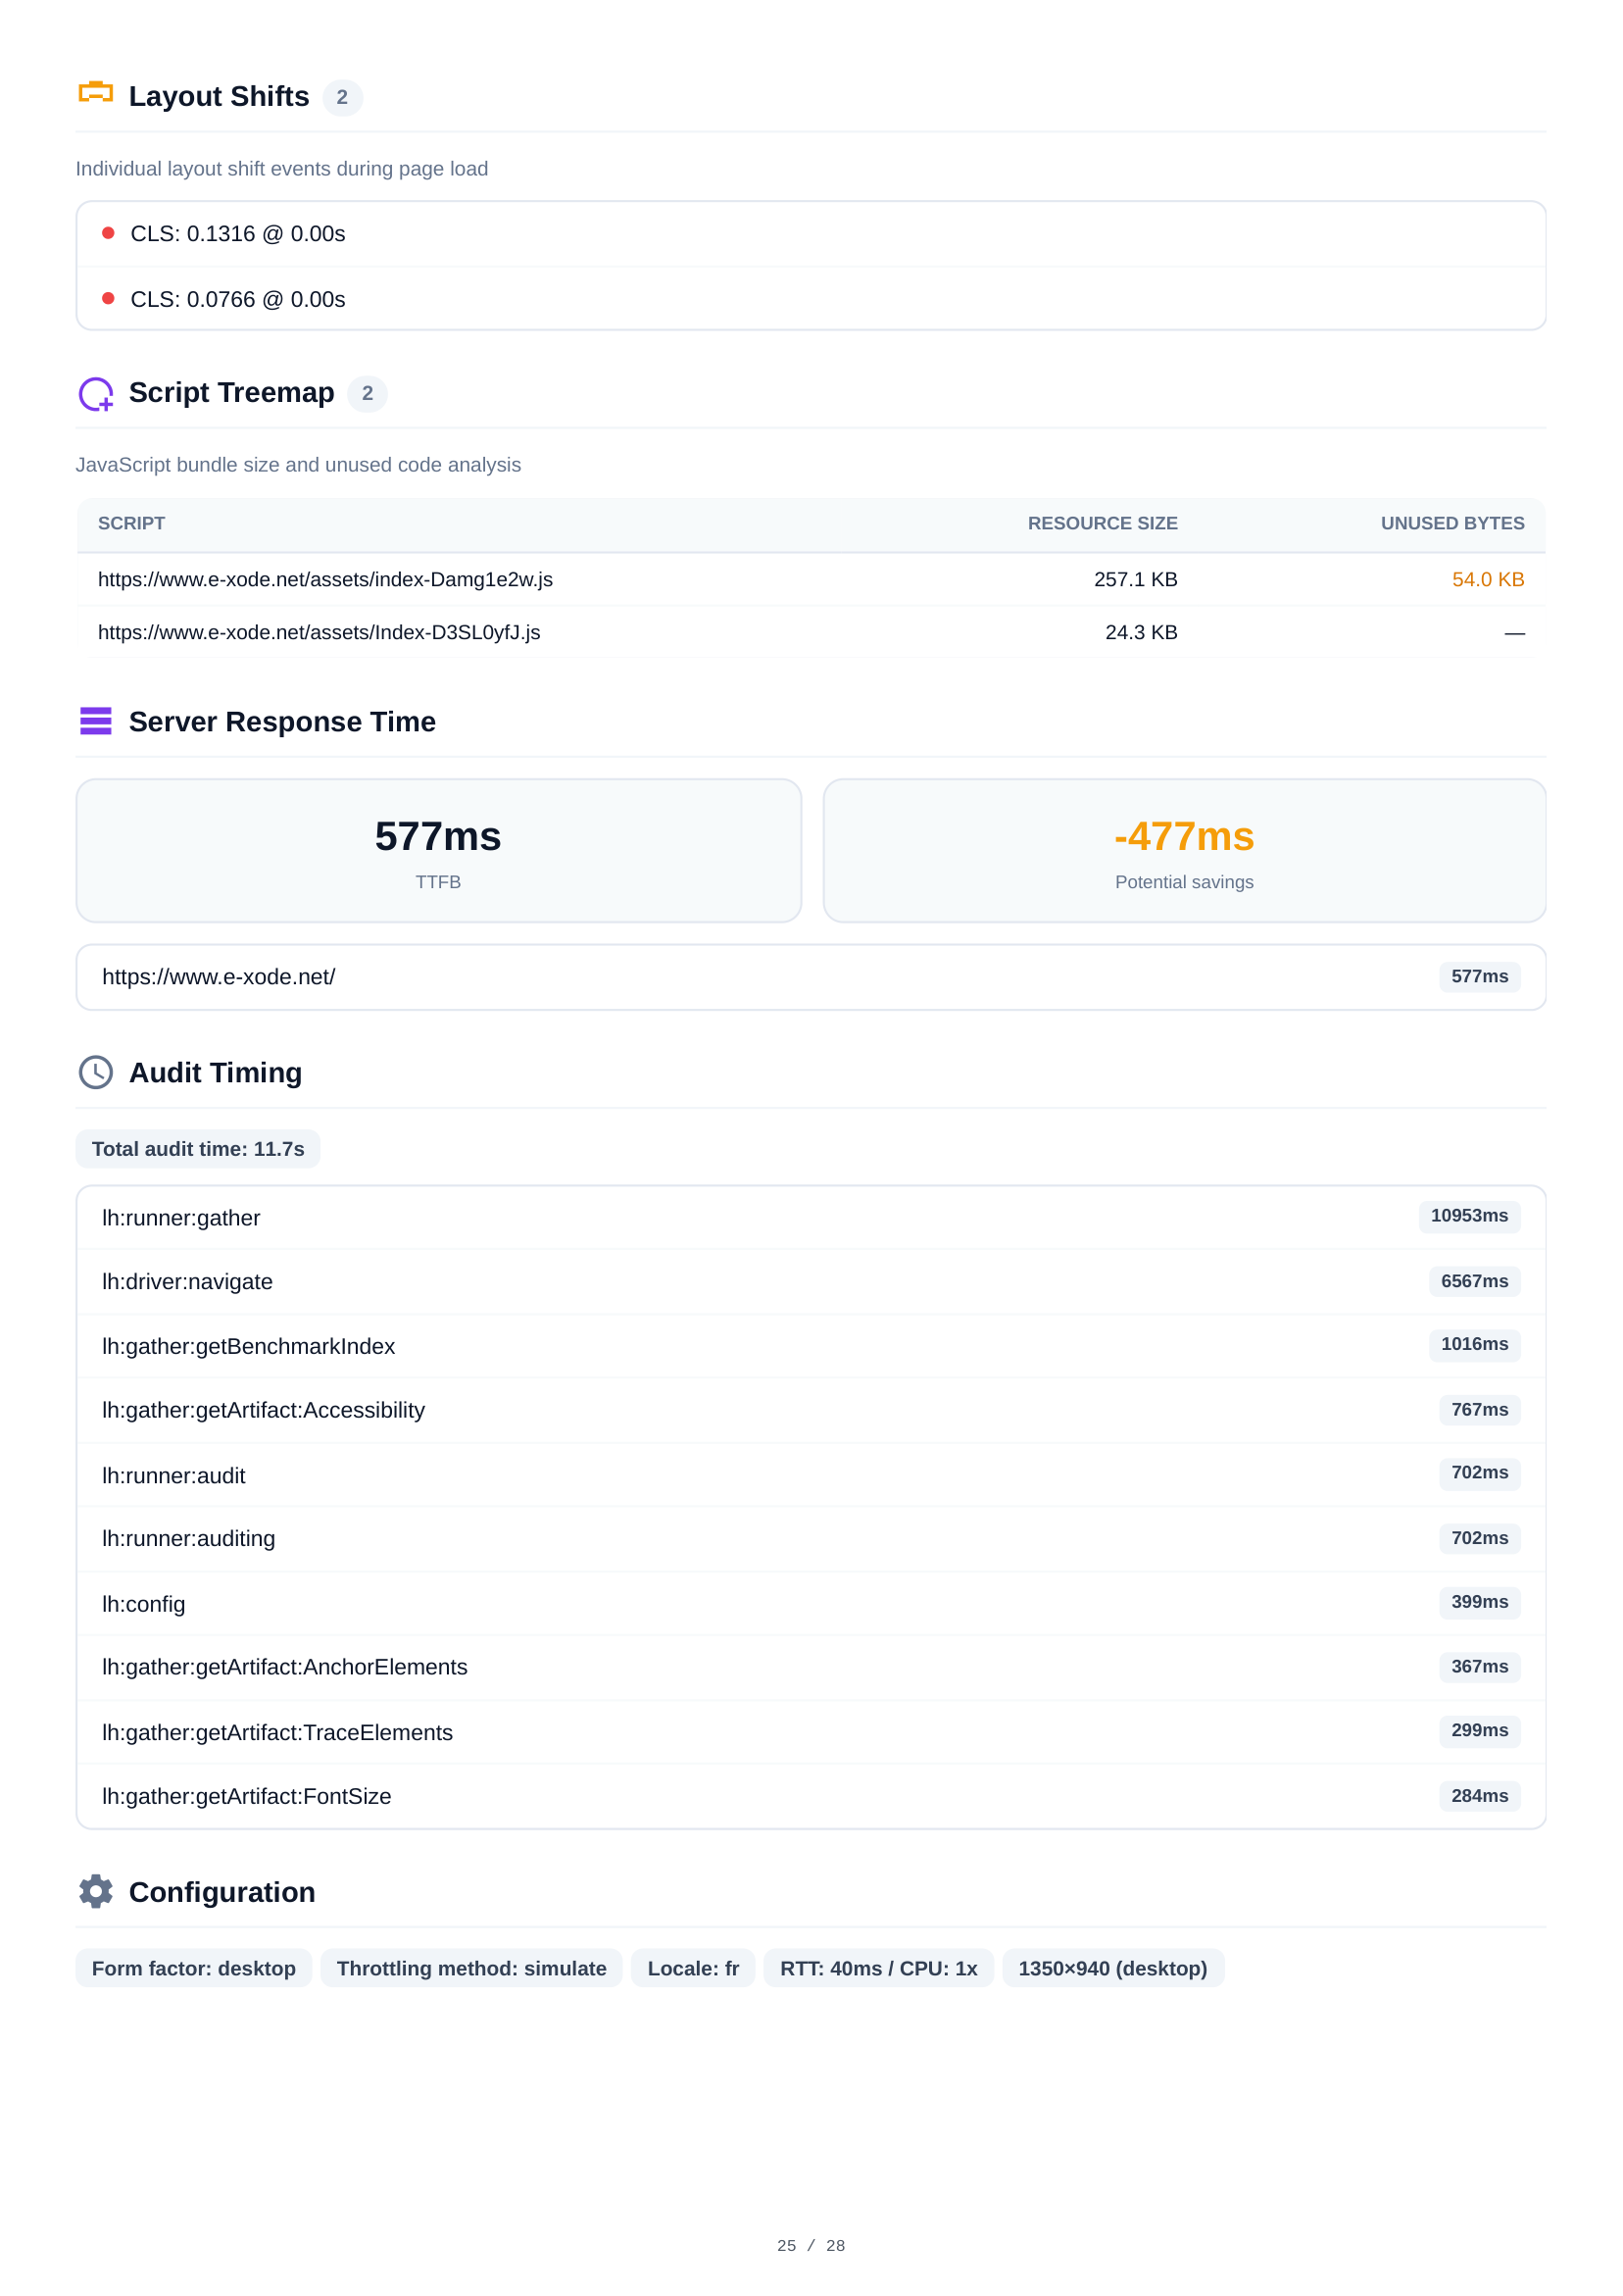
Mobile Layout Shifts & Script Analysis
Layout shift analysis reveals 2 individual CLS events during page load with exact timestamps and impact scores. The script treemap visualizes JavaScript bundle sizes and unused code, helping identify optimization targets. Console output shows 1 hydration mismatch warning.
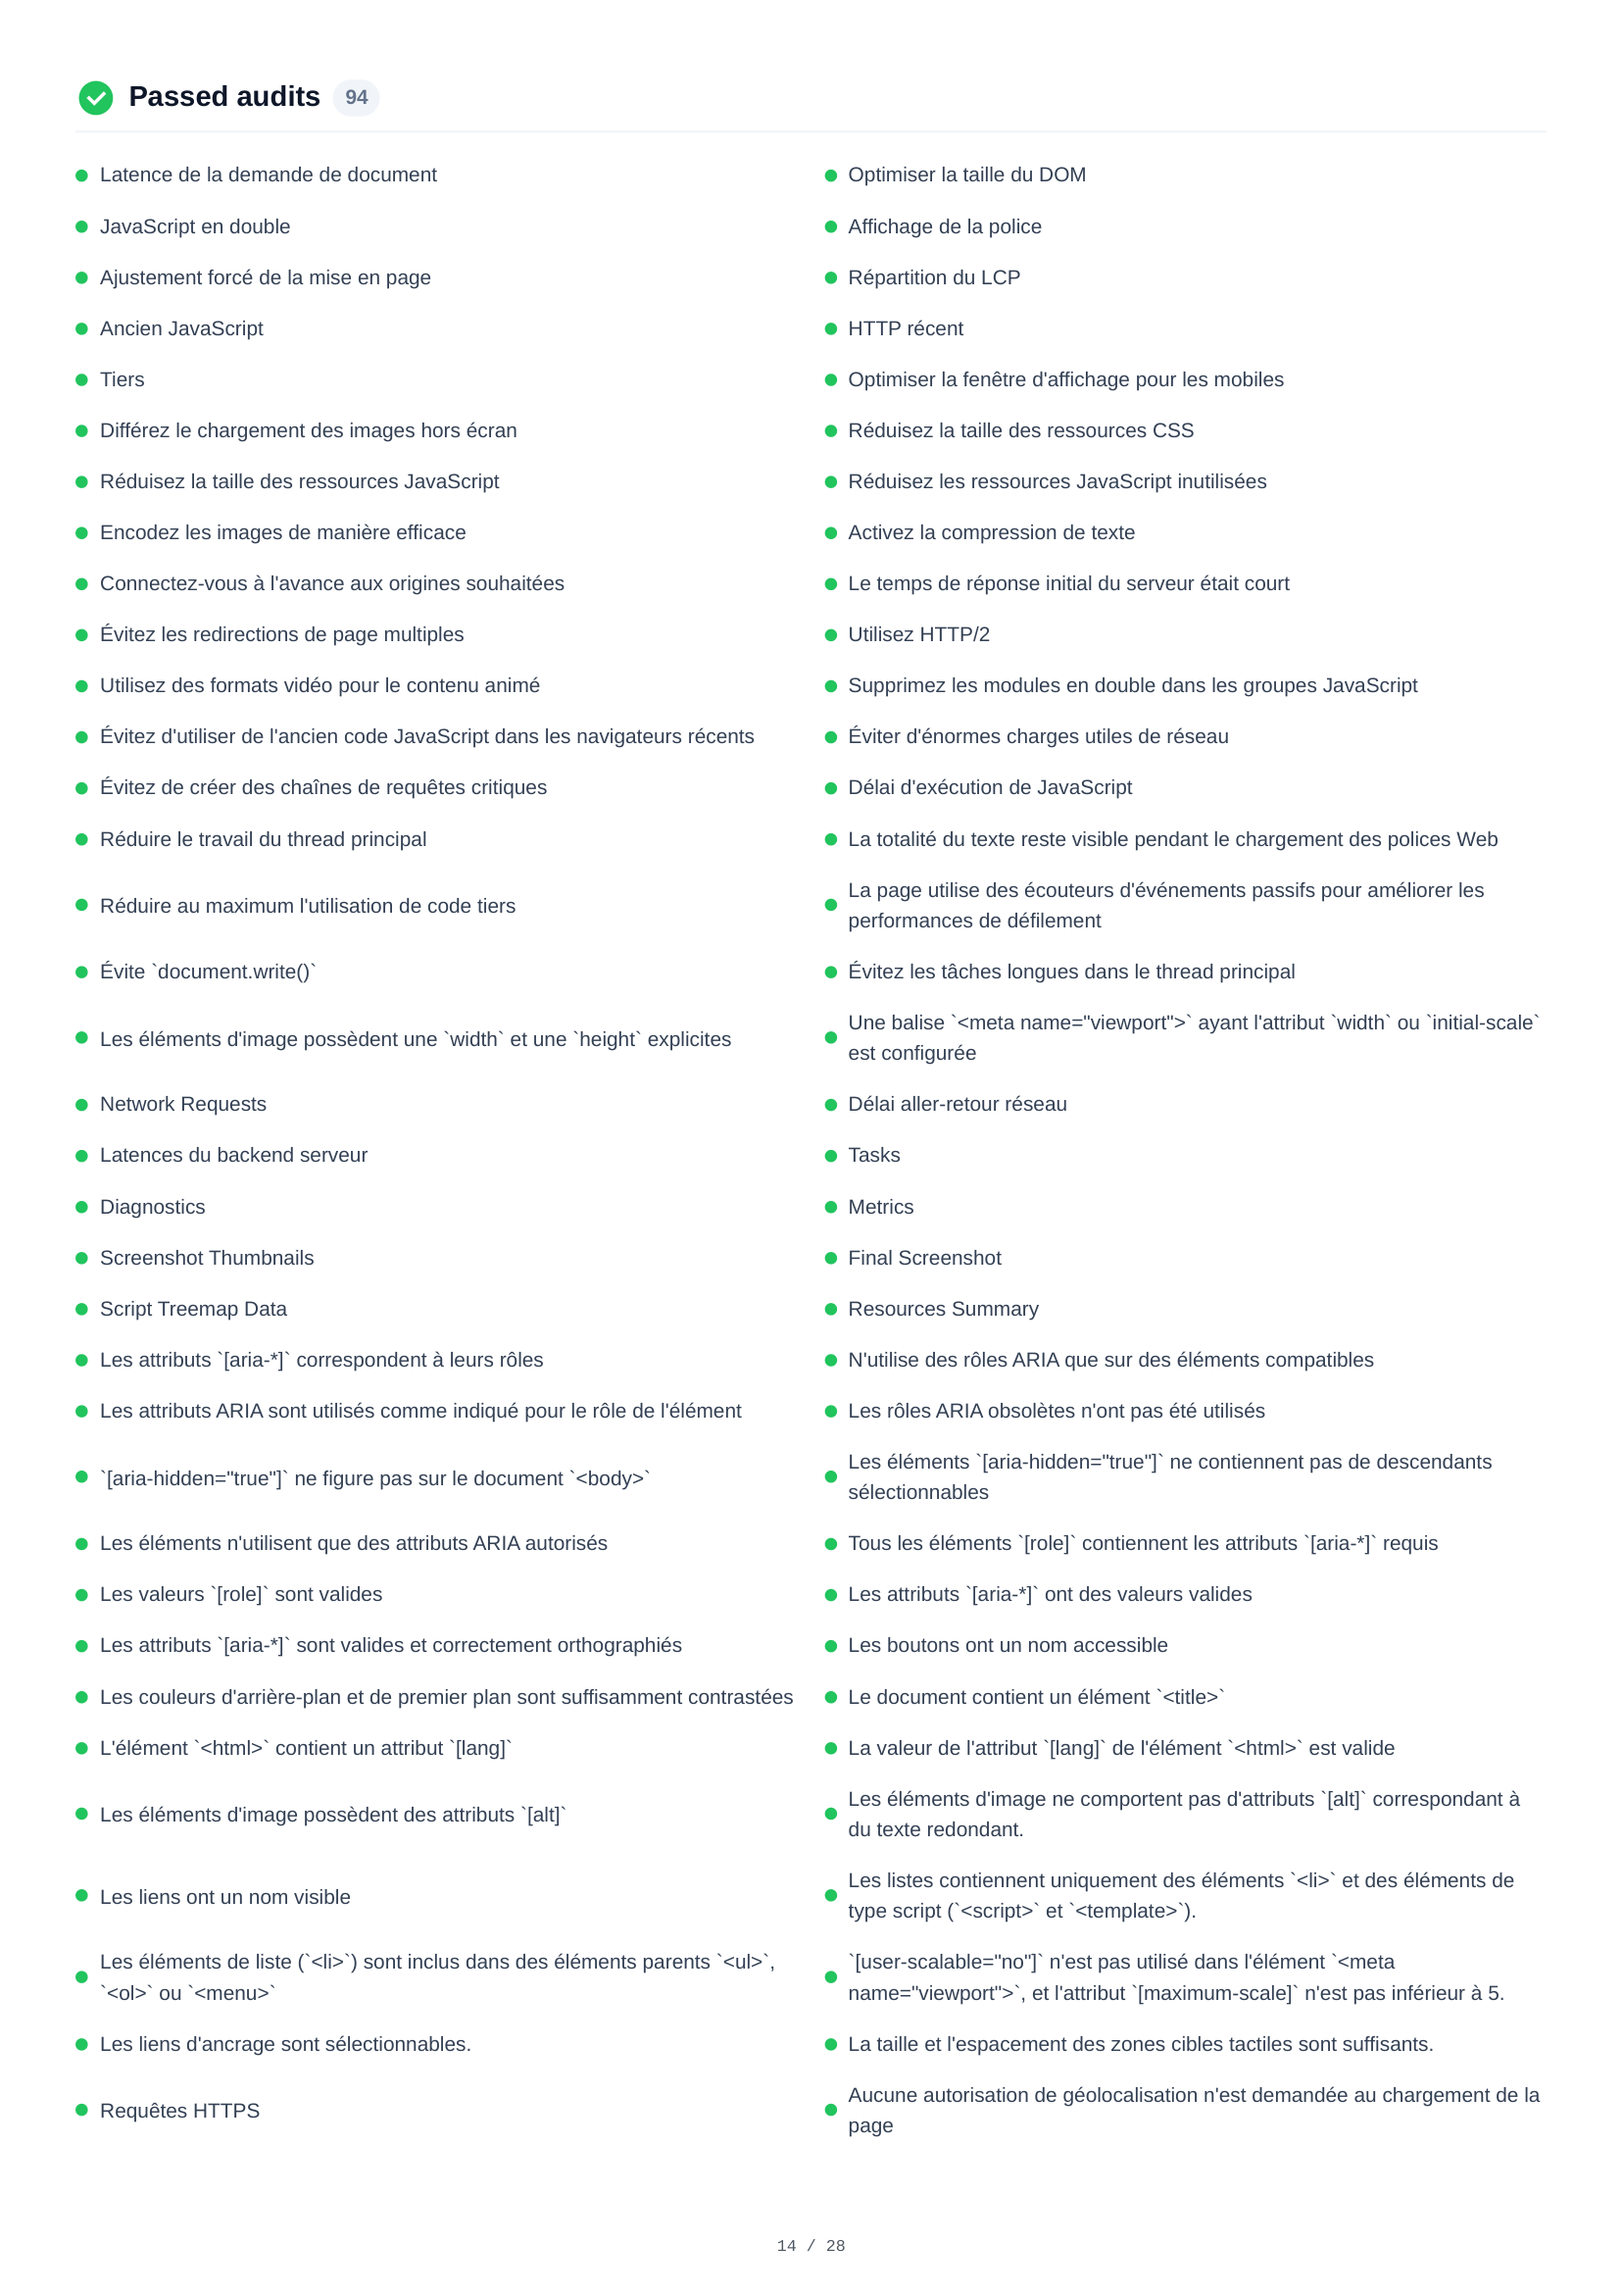
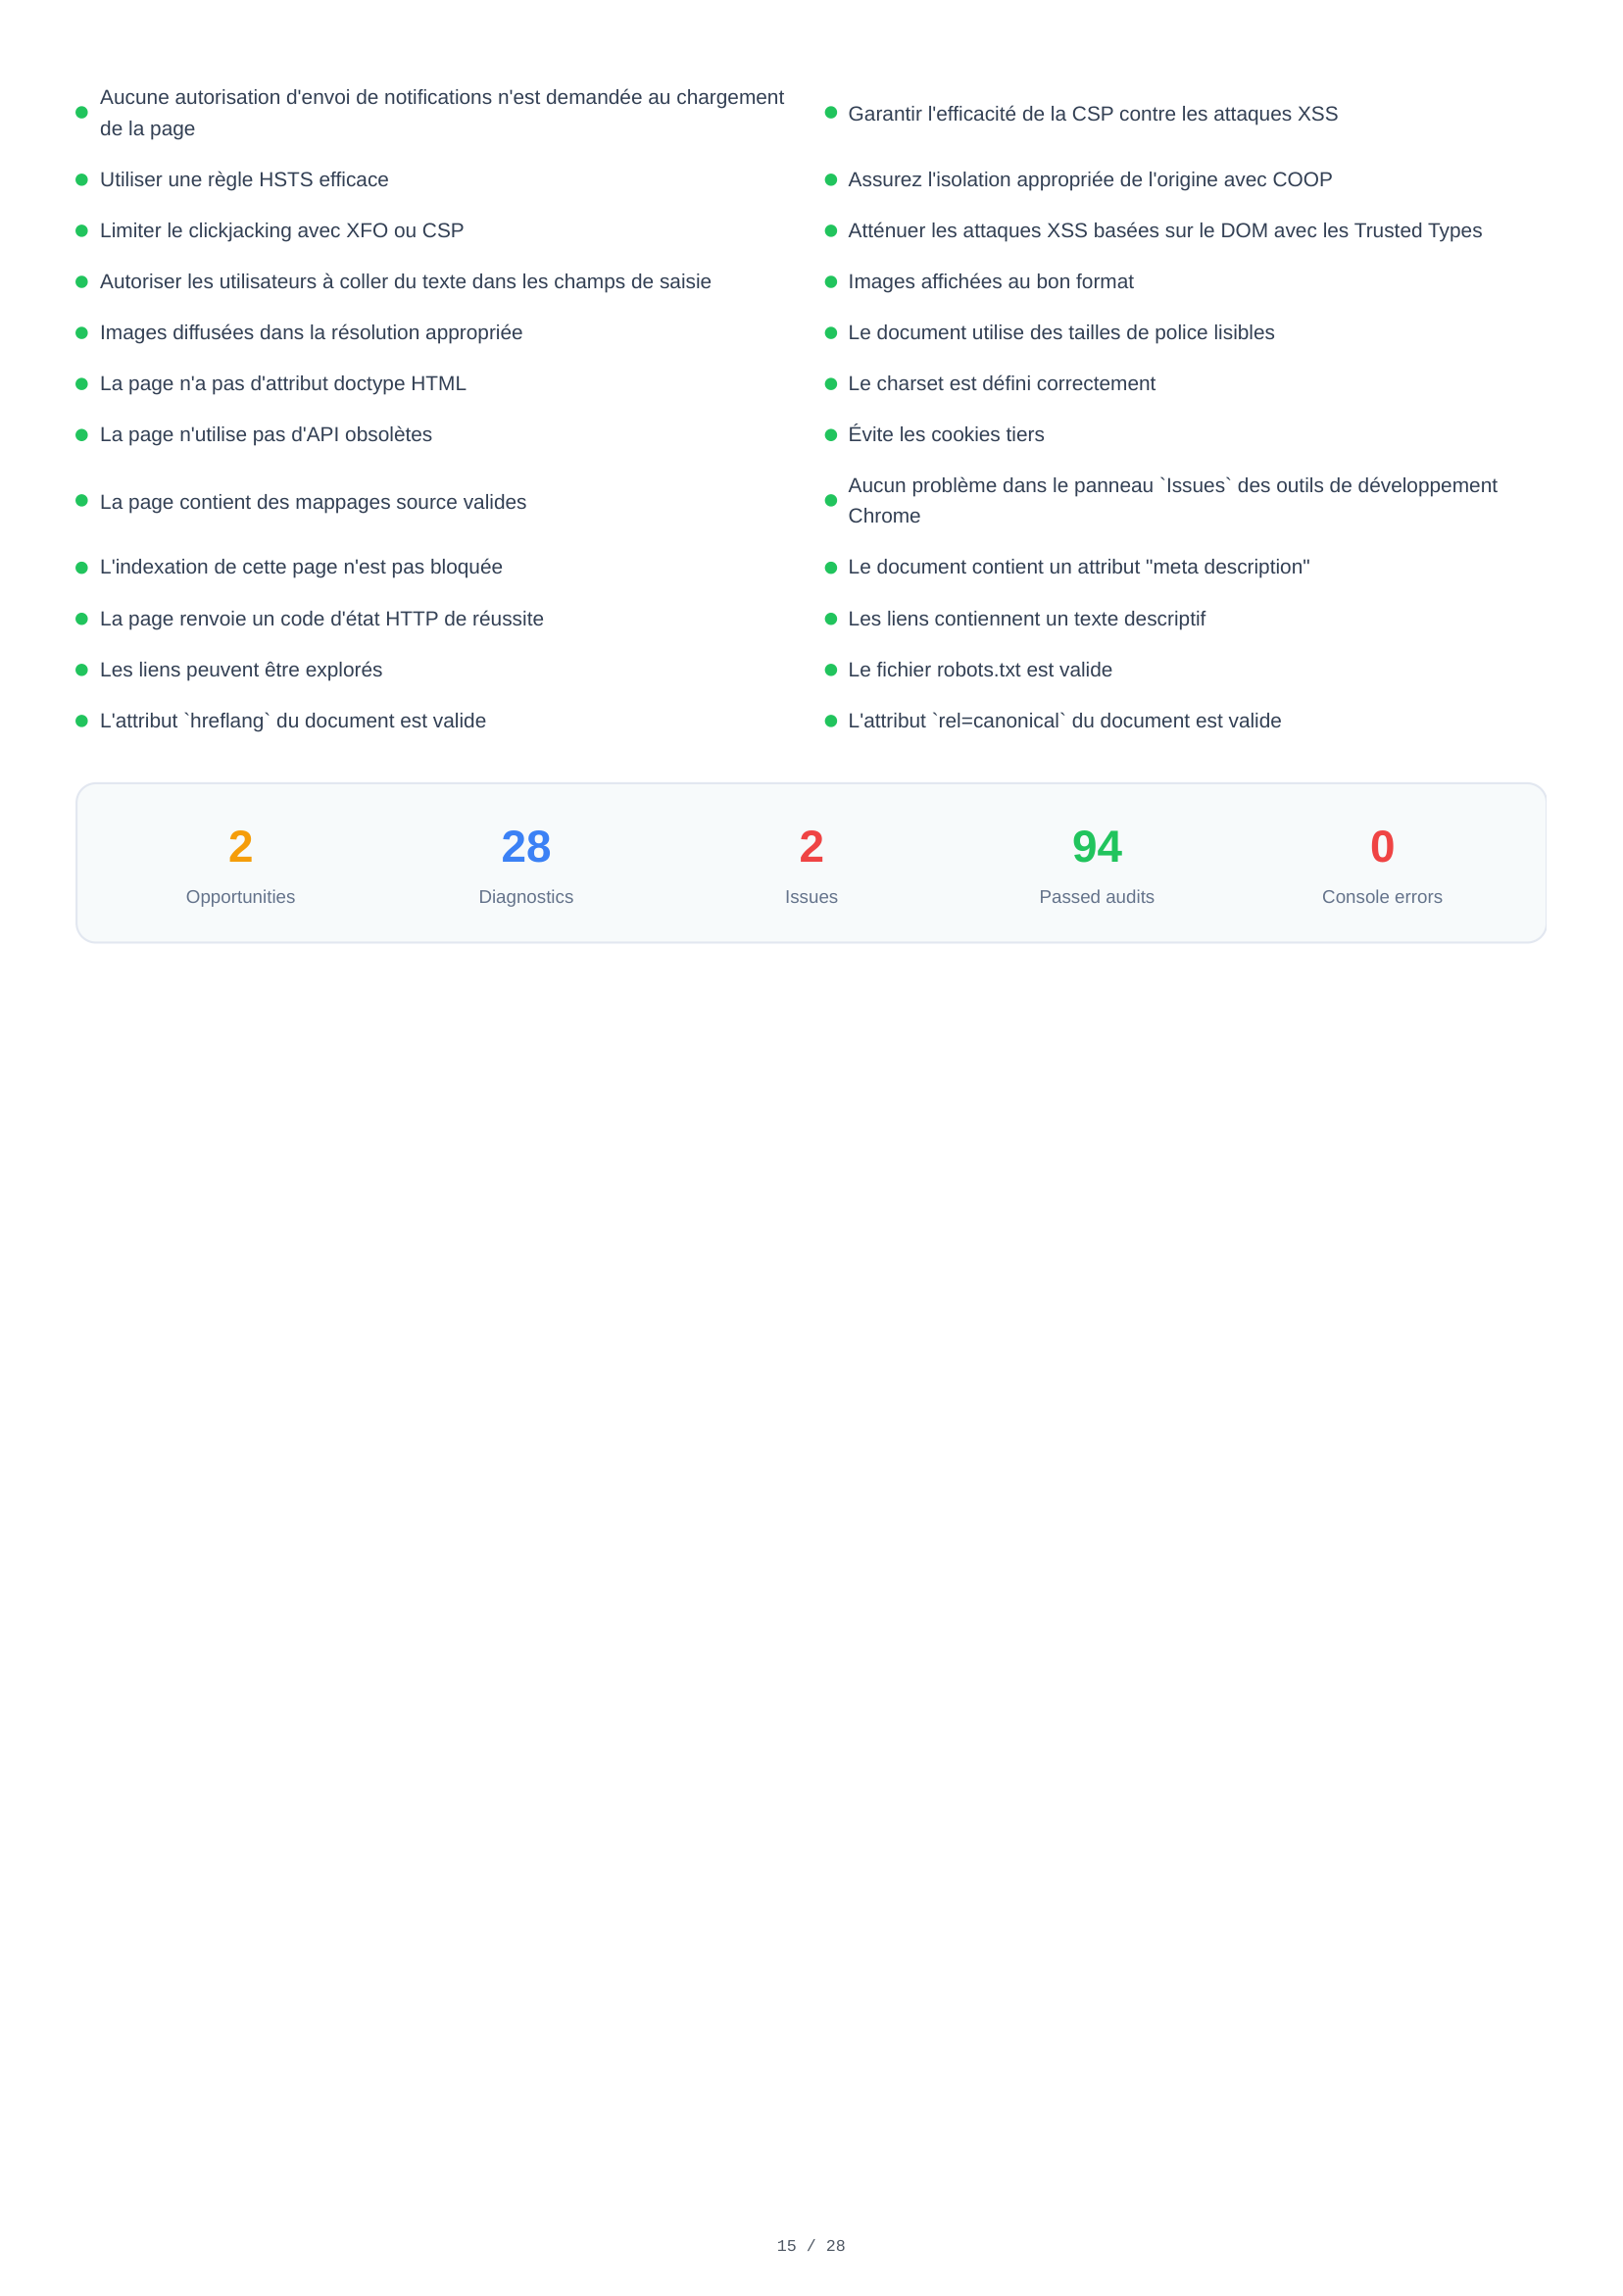
Mobile Passed Audits
A full list of 94 passed audits across all categories — Performance, Accessibility, Best Practices, and SEO. This confirms which standards the page already meets, from proper image formats and HTTPS usage to accessible labels, efficient caching, and search engine optimization.
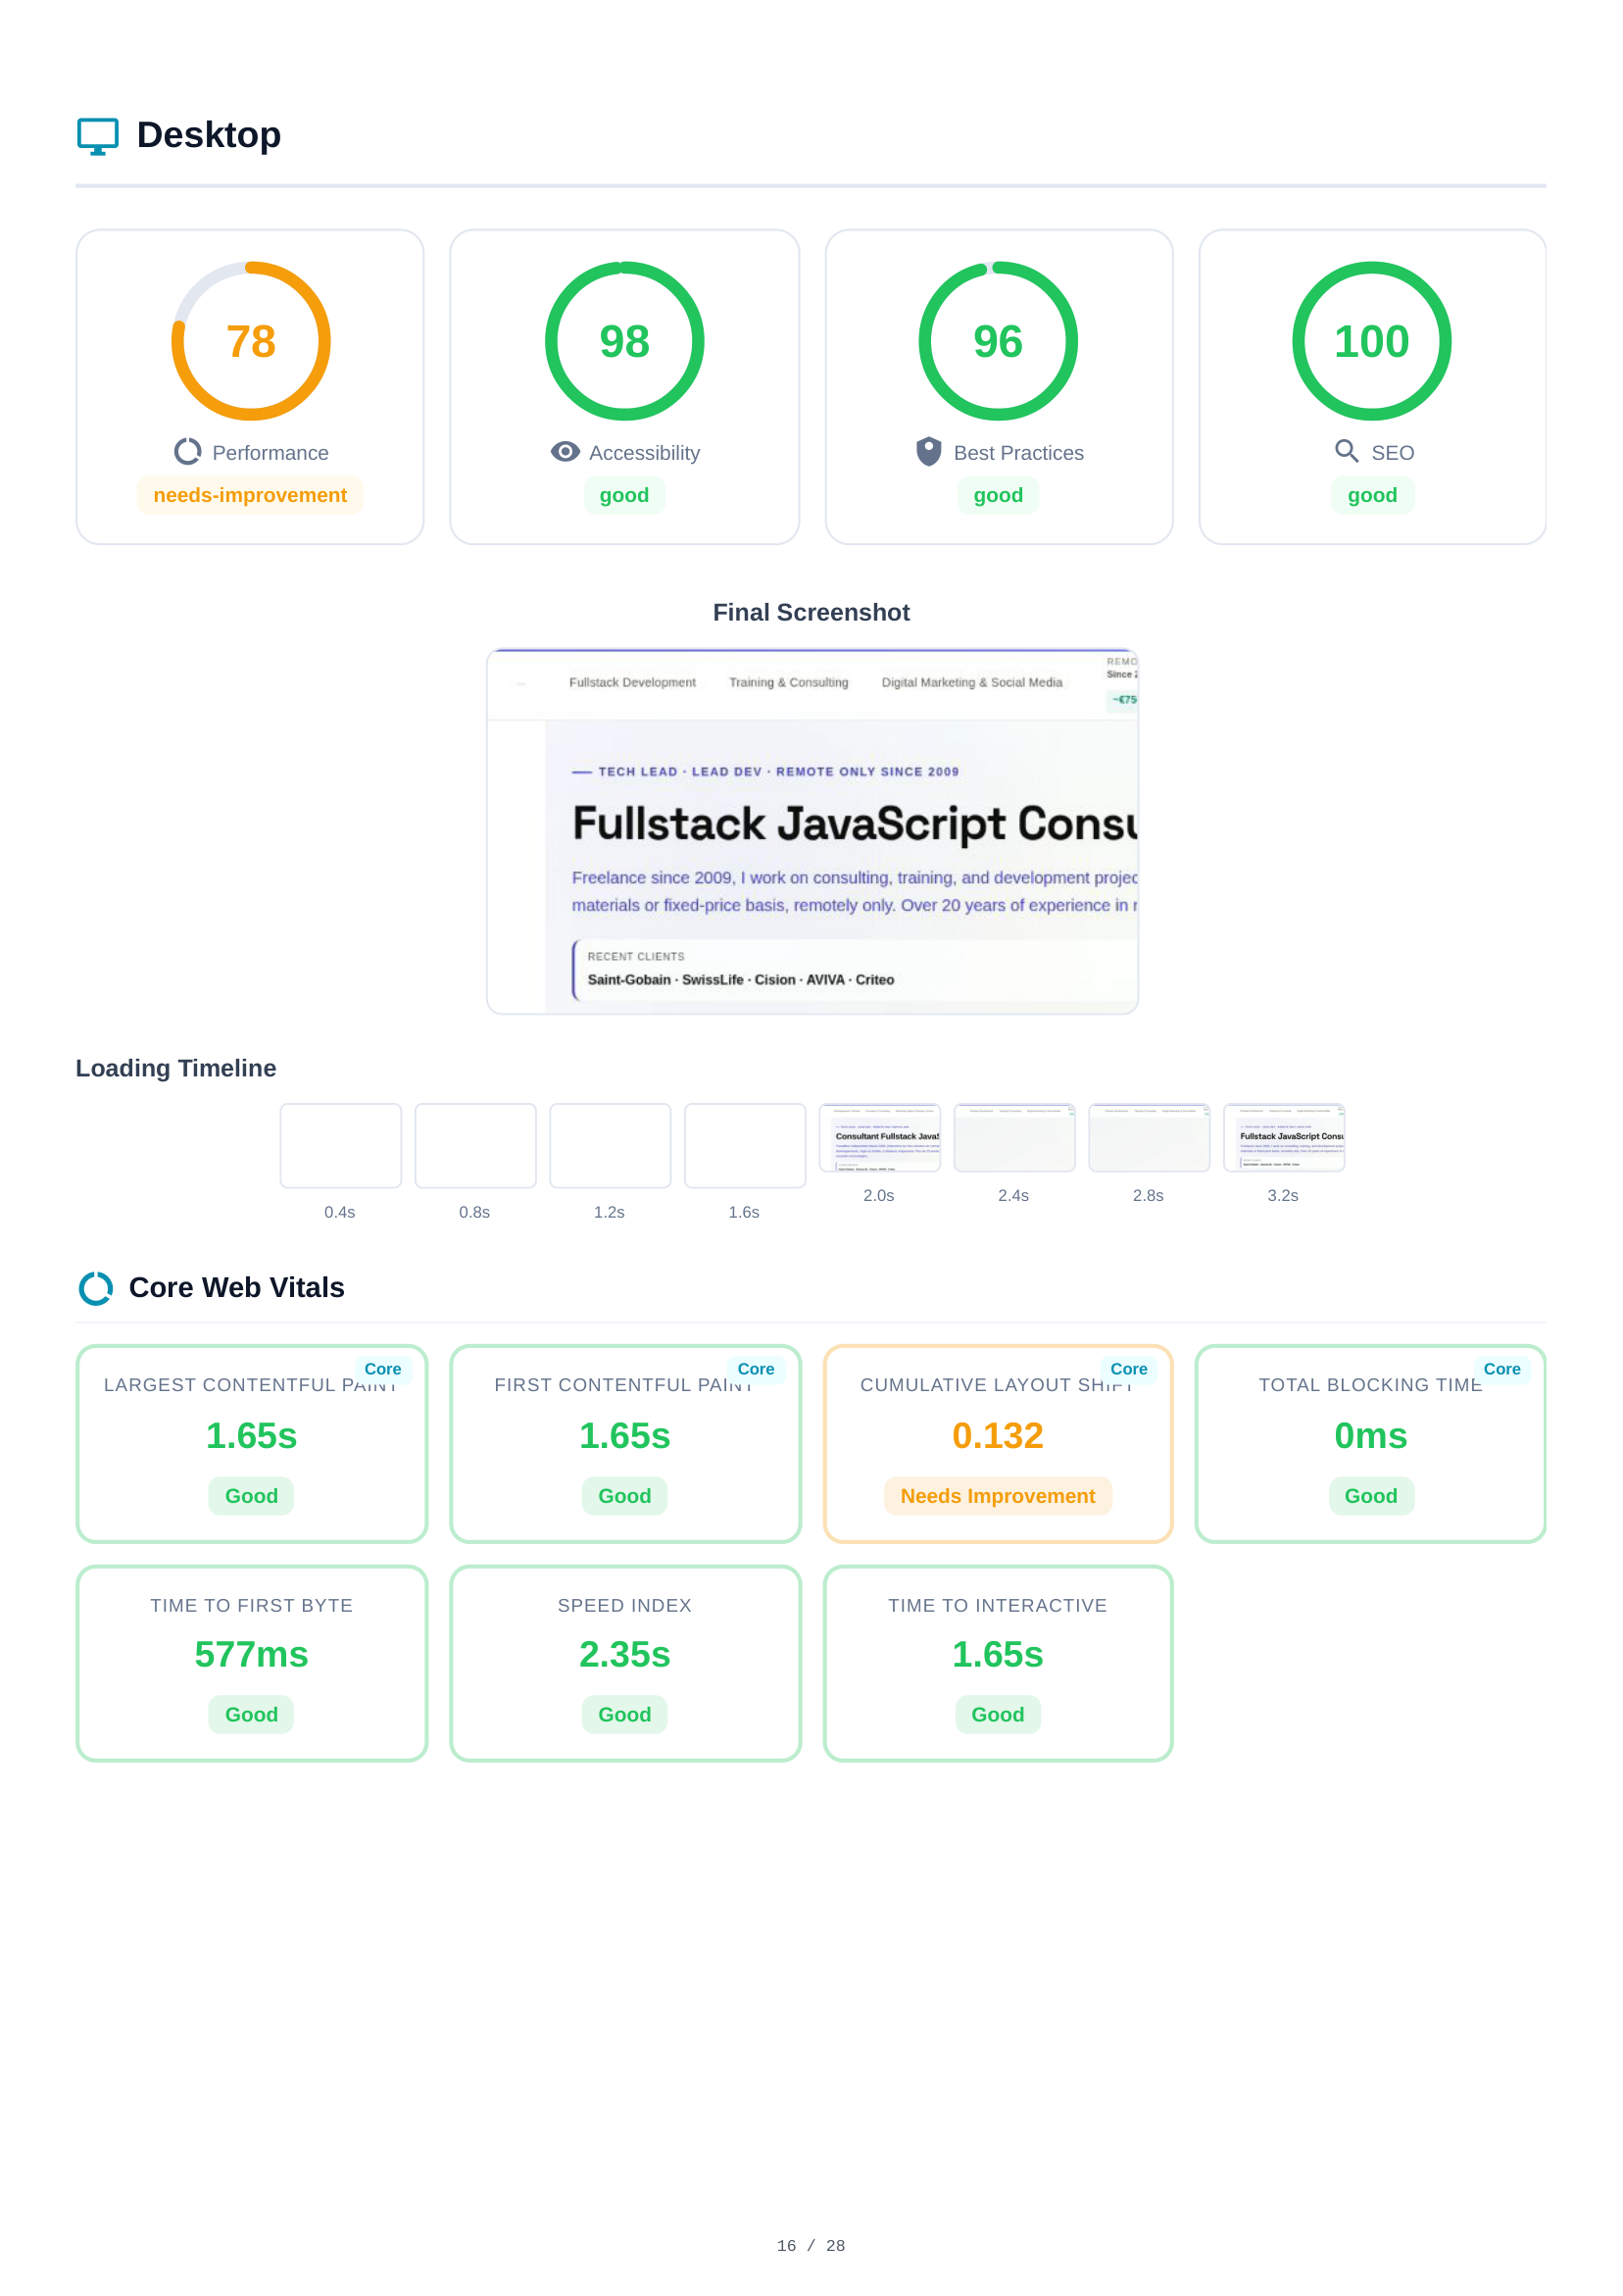
Desktop Scores & Core Web Vitals
The desktop analysis mirrors the mobile structure. Scores: Performance (78), Accessibility (98), Best Practices (96), SEO (100). The loading timeline and final screenshot show desktop rendering behavior. Core Web Vitals are measured independently, often showing different values due to viewport and network conditions.
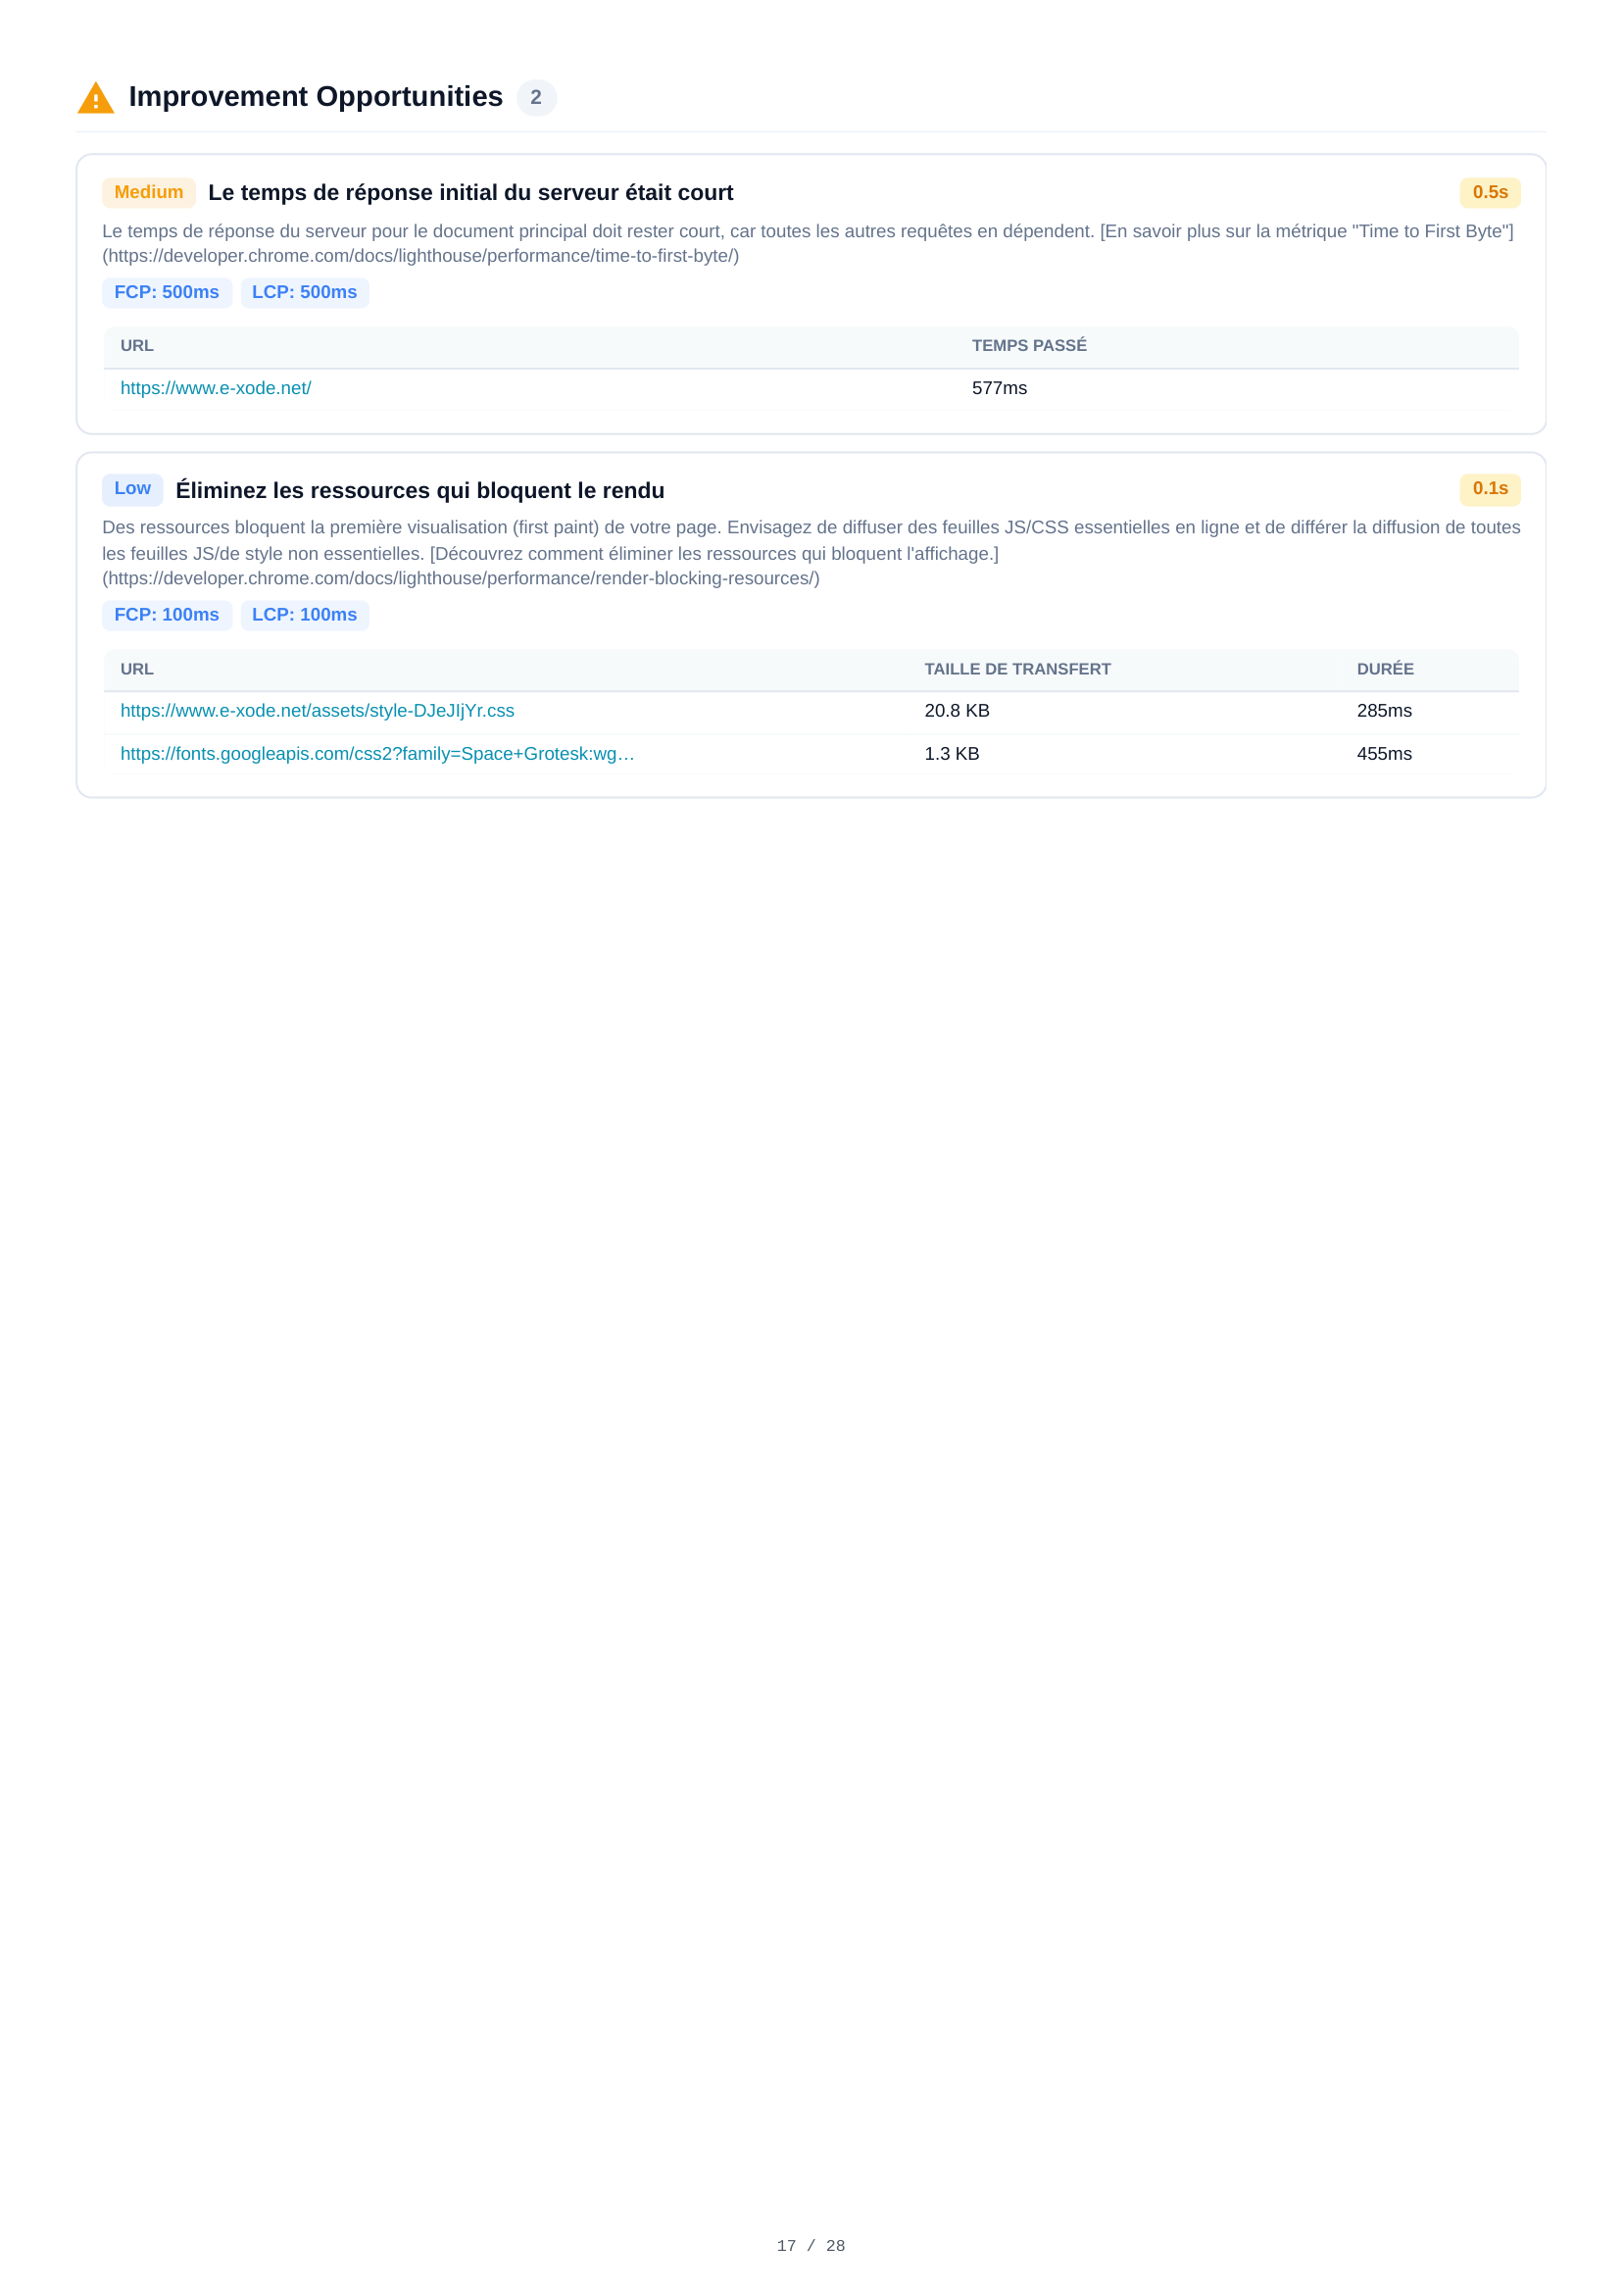
Desktop Opportunities
Two improvement opportunities for desktop, including server response time (0.5s) and resource delivery optimizations. While similar to mobile findings, estimated savings and thresholds differ due to desktop's faster baseline performance.
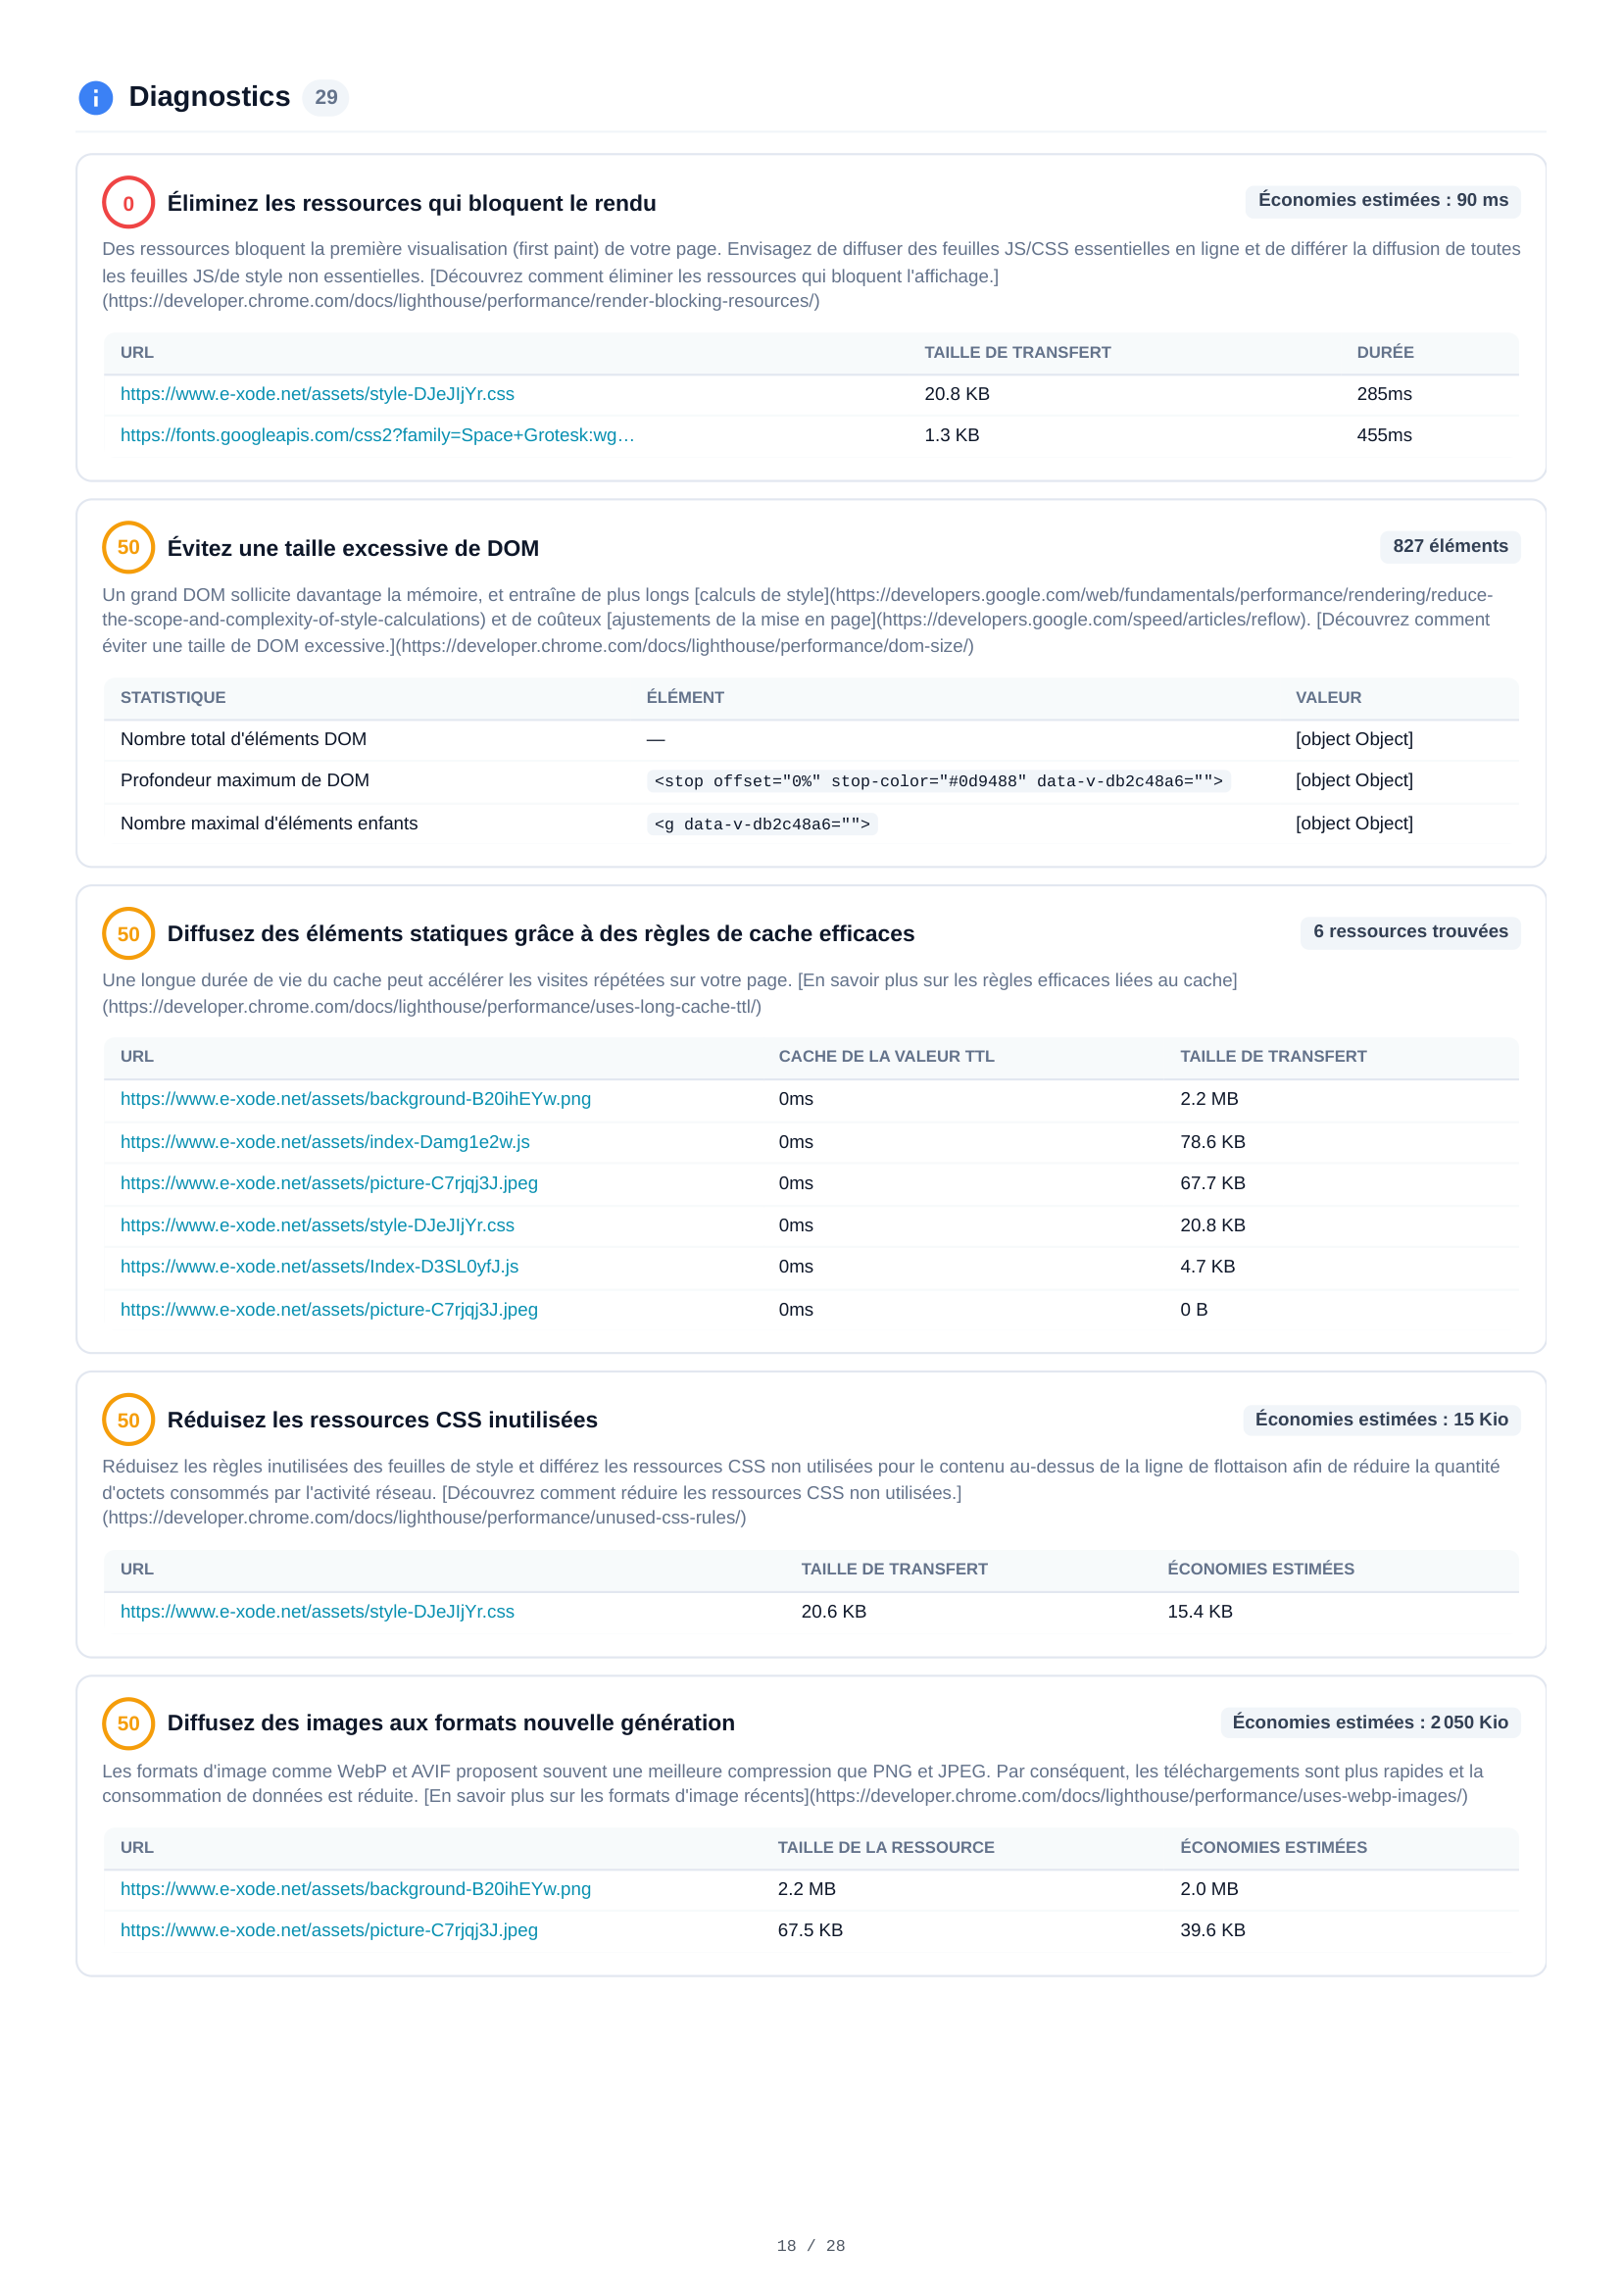
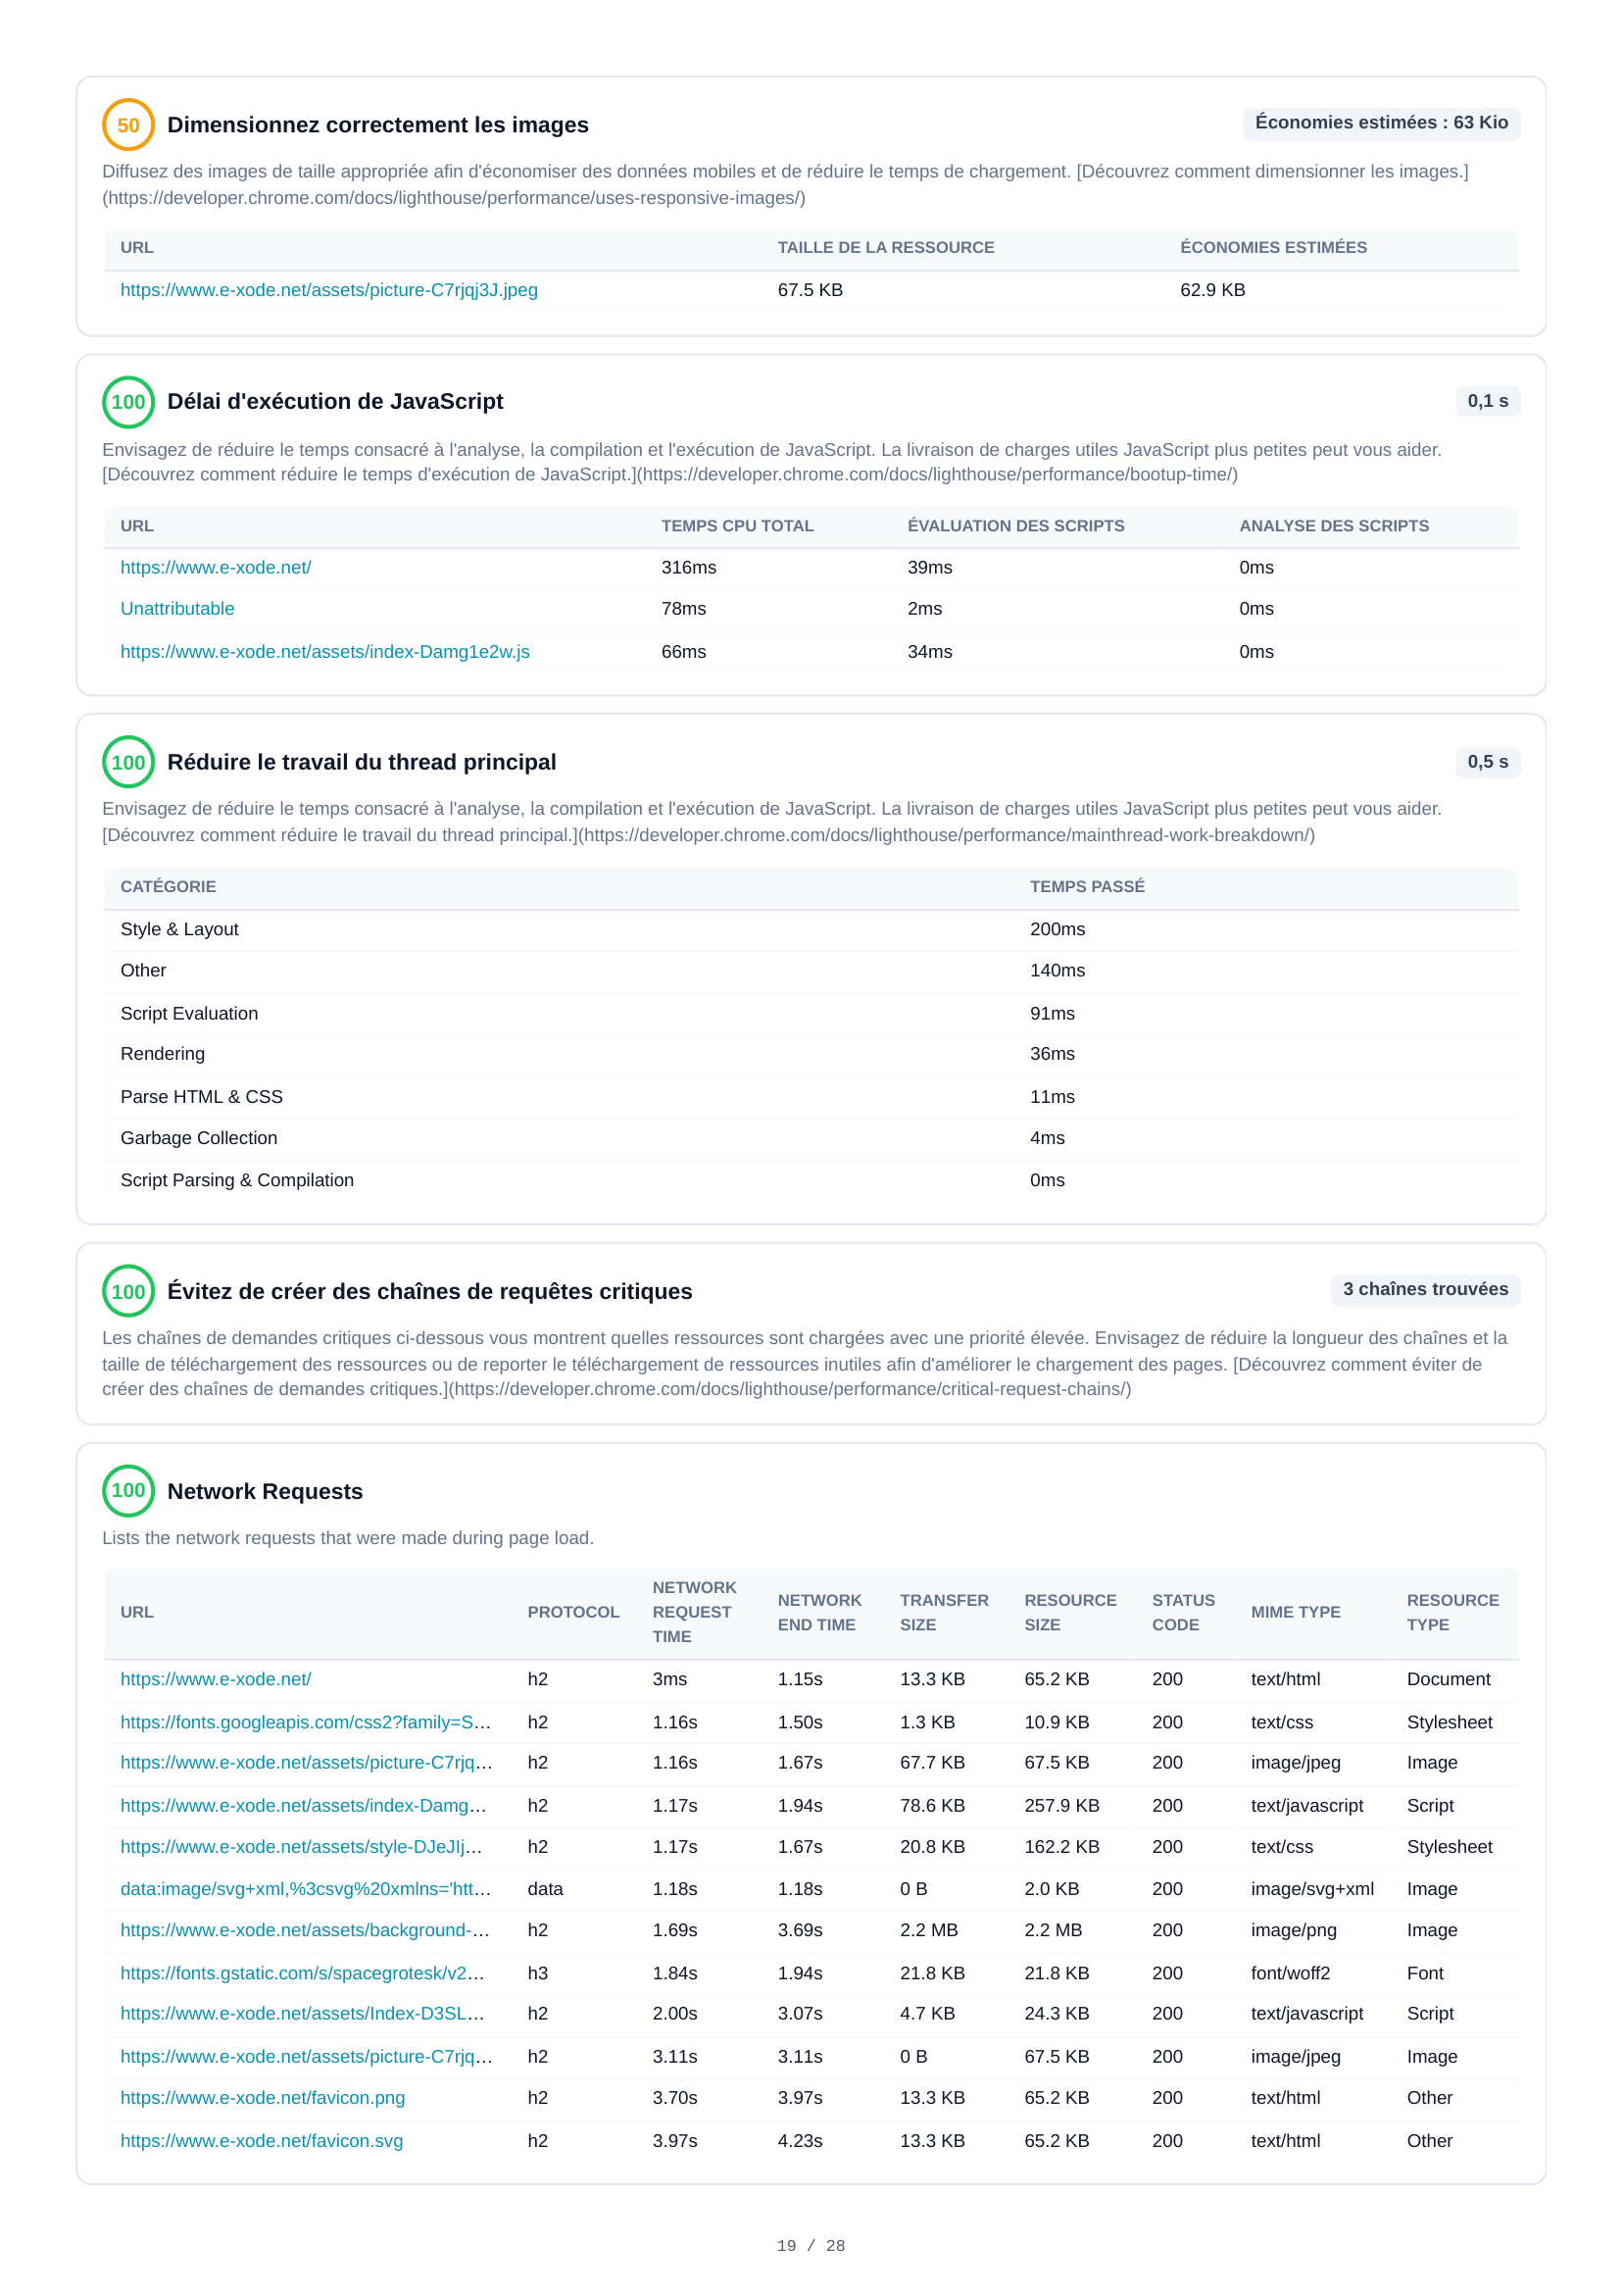
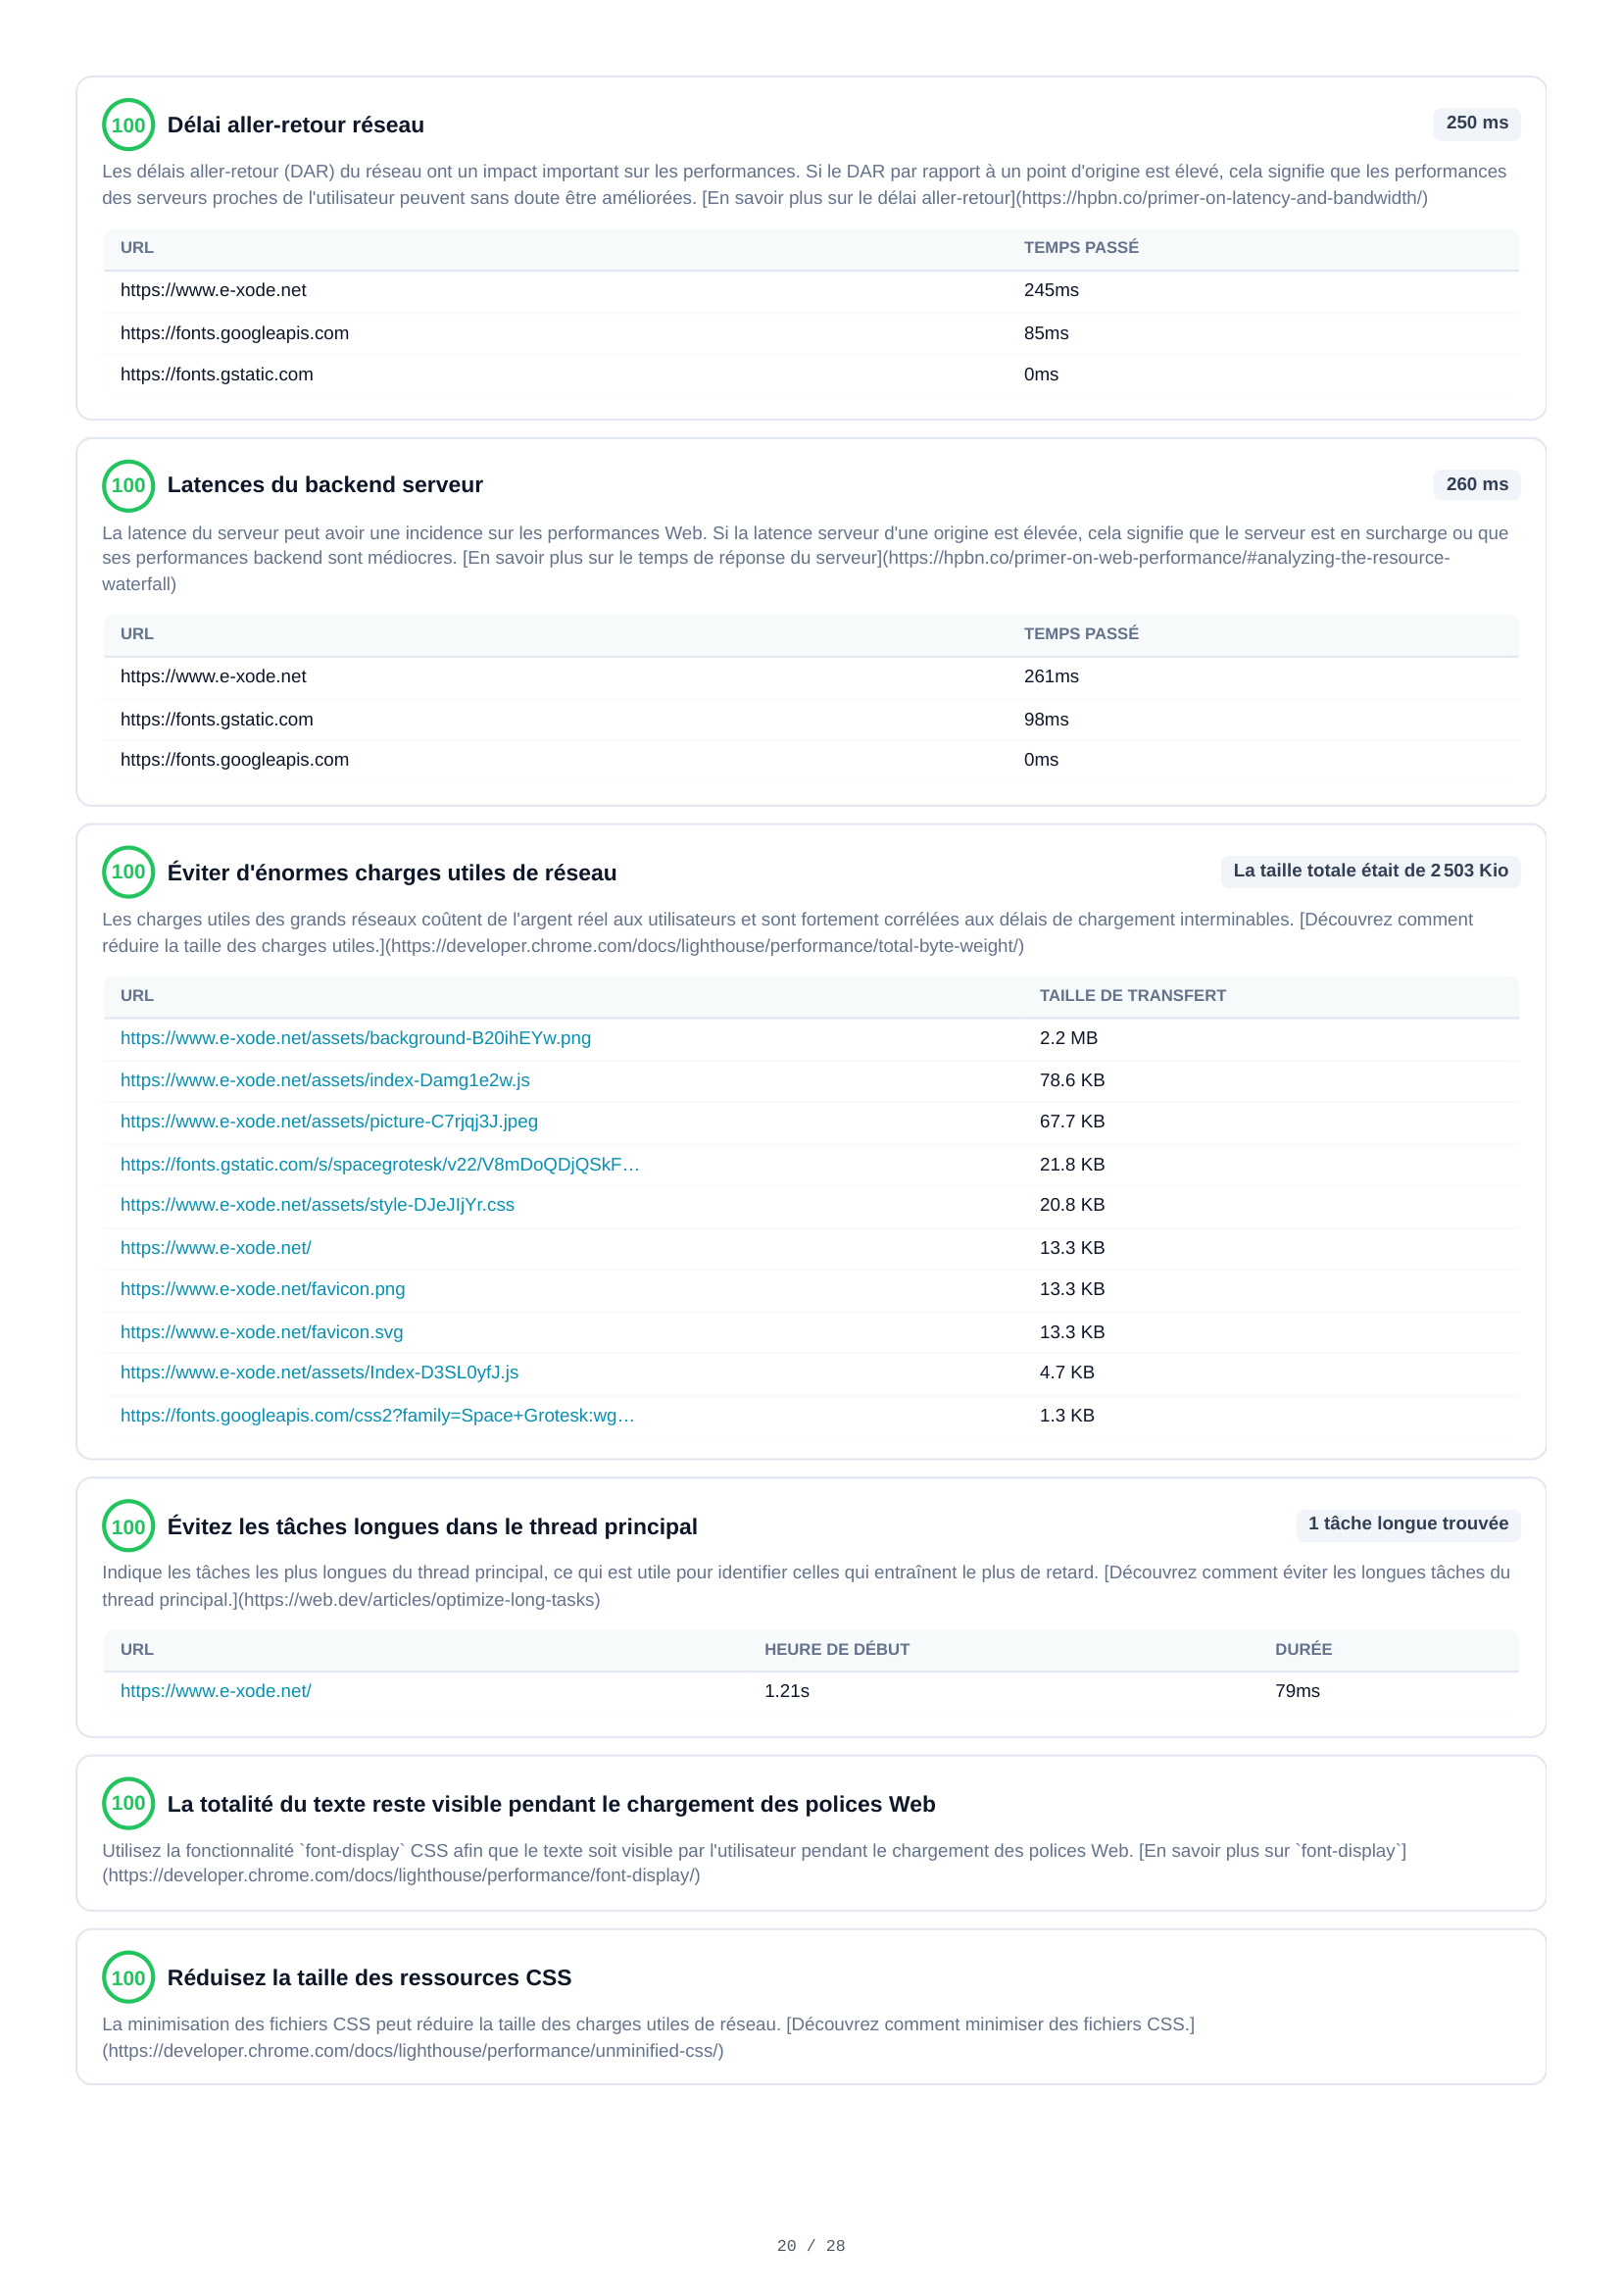
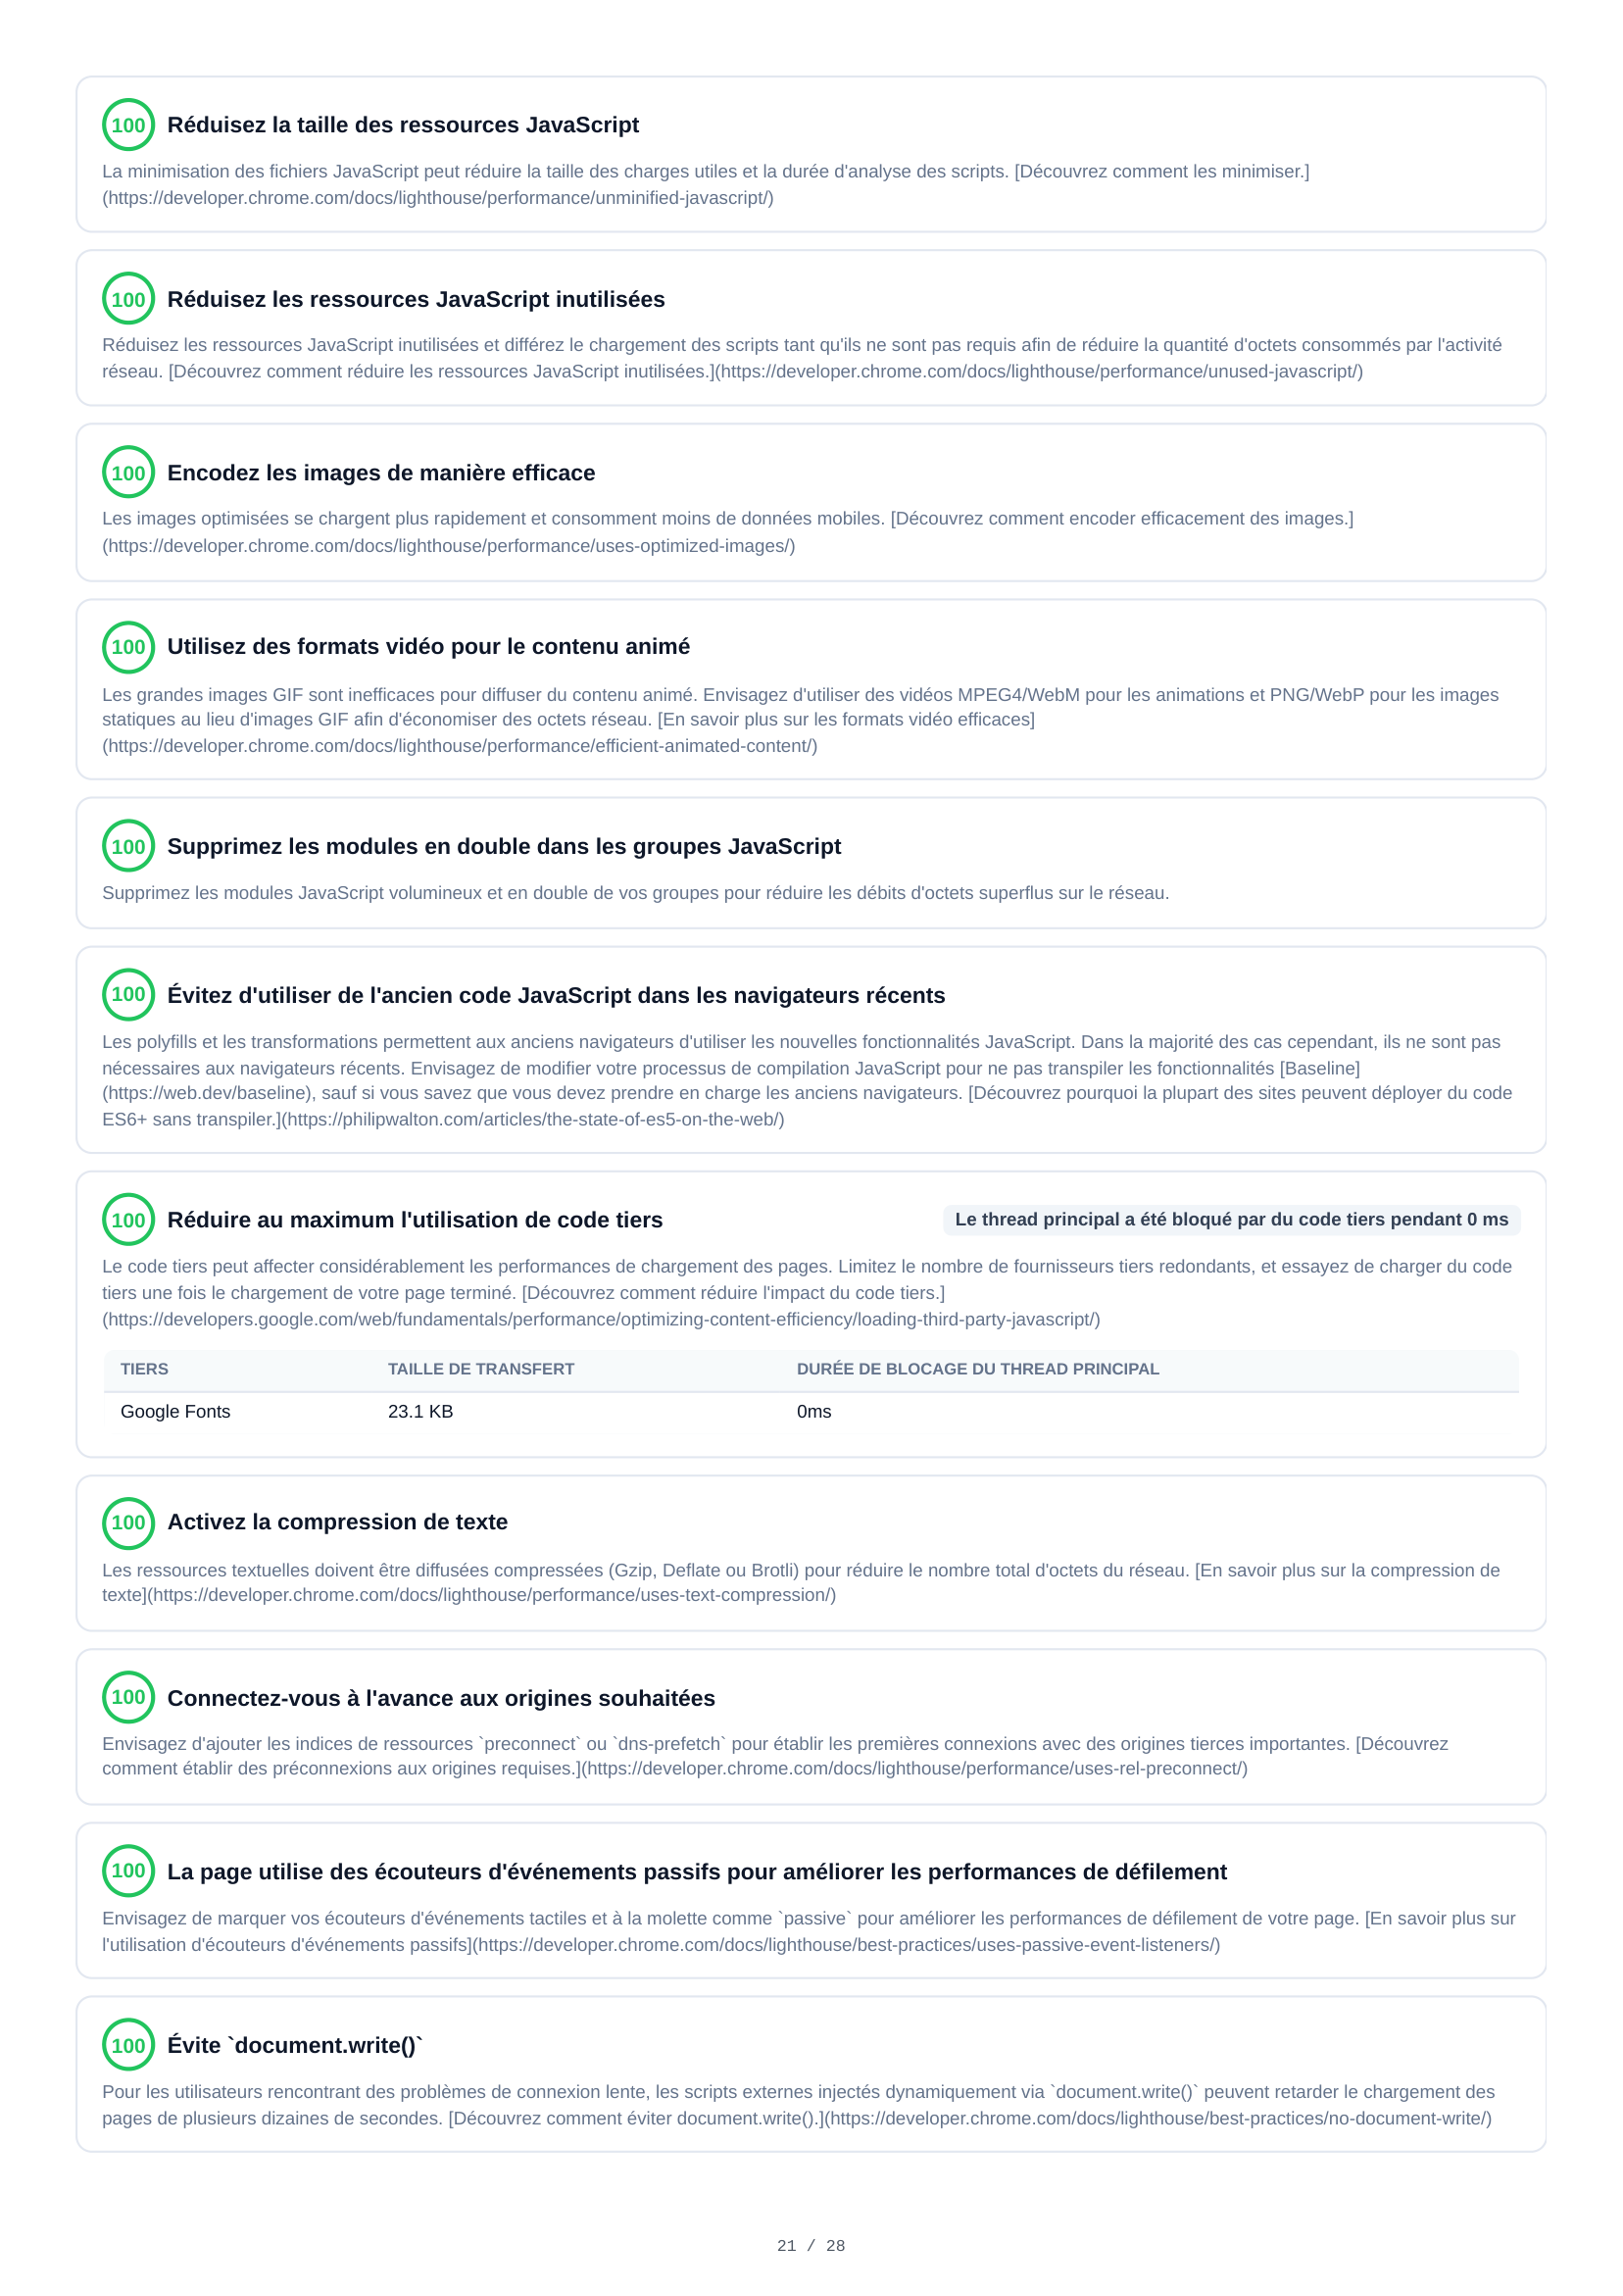
Desktop Diagnostics
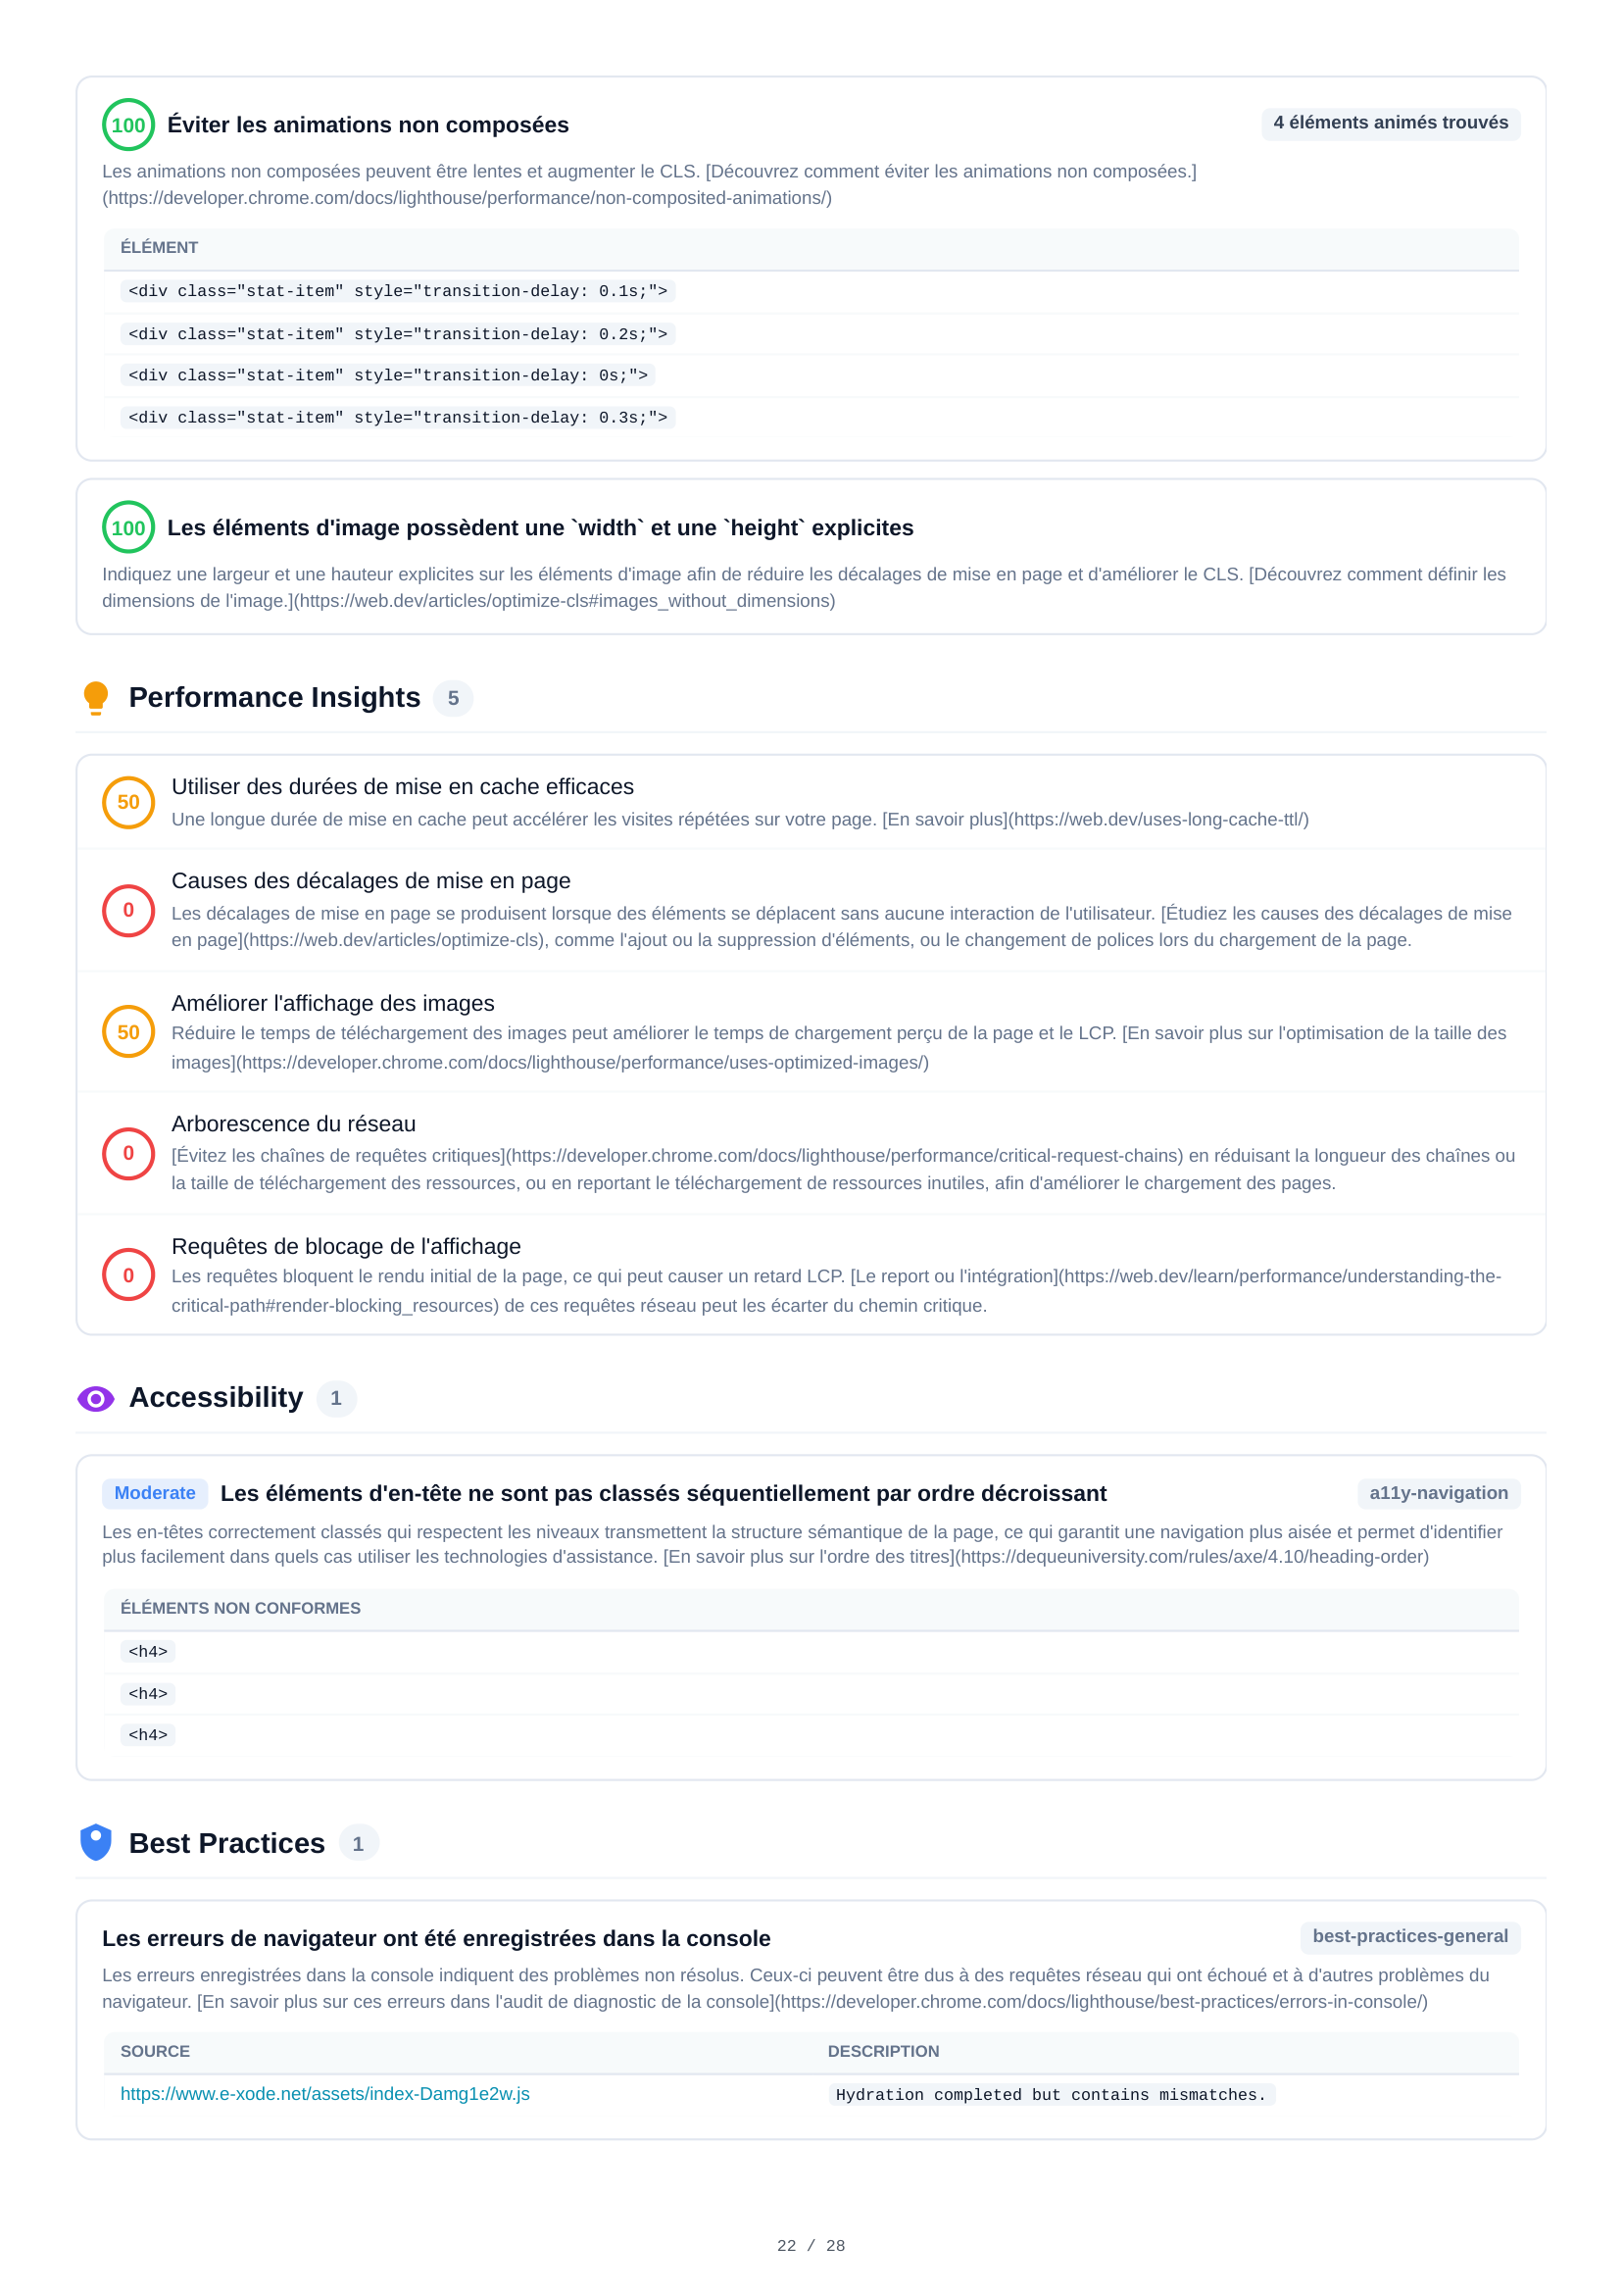
29 diagnostic audits span 5 pages for desktop analysis. Findings include render-blocking resources (90ms estimated savings), image sizing optimizations (63 KB potential savings), network round-trip delays (250ms), JavaScript and CSS minimization, non-composited animation issues, and detailed performance audits.
Desktop Resources
Desktop resource analysis shows the same 24 requests and 4.9 MB total. The breakdown mirrors mobile: Images dominate at 2.4 MB, followed by Scripts at 2.3 MB. Resource details help identify the heaviest assets for optimization.

Desktop Network Requests
All 12 HTTP requests during desktop page load listed with full details — URL, type, protocol, status, transfer and resource sizes, and priority levels. Allows direct comparison with mobile network behavior.

Desktop Layout Shifts & Script Analysis
Desktop layout shift analysis reveals 2 CLS events with combined scores. The script treemap shows JavaScript bundle composition and unused code percentages. Console reports 1 hydration mismatch warning — identical to mobile, confirming a code-level issue, not device-specific.
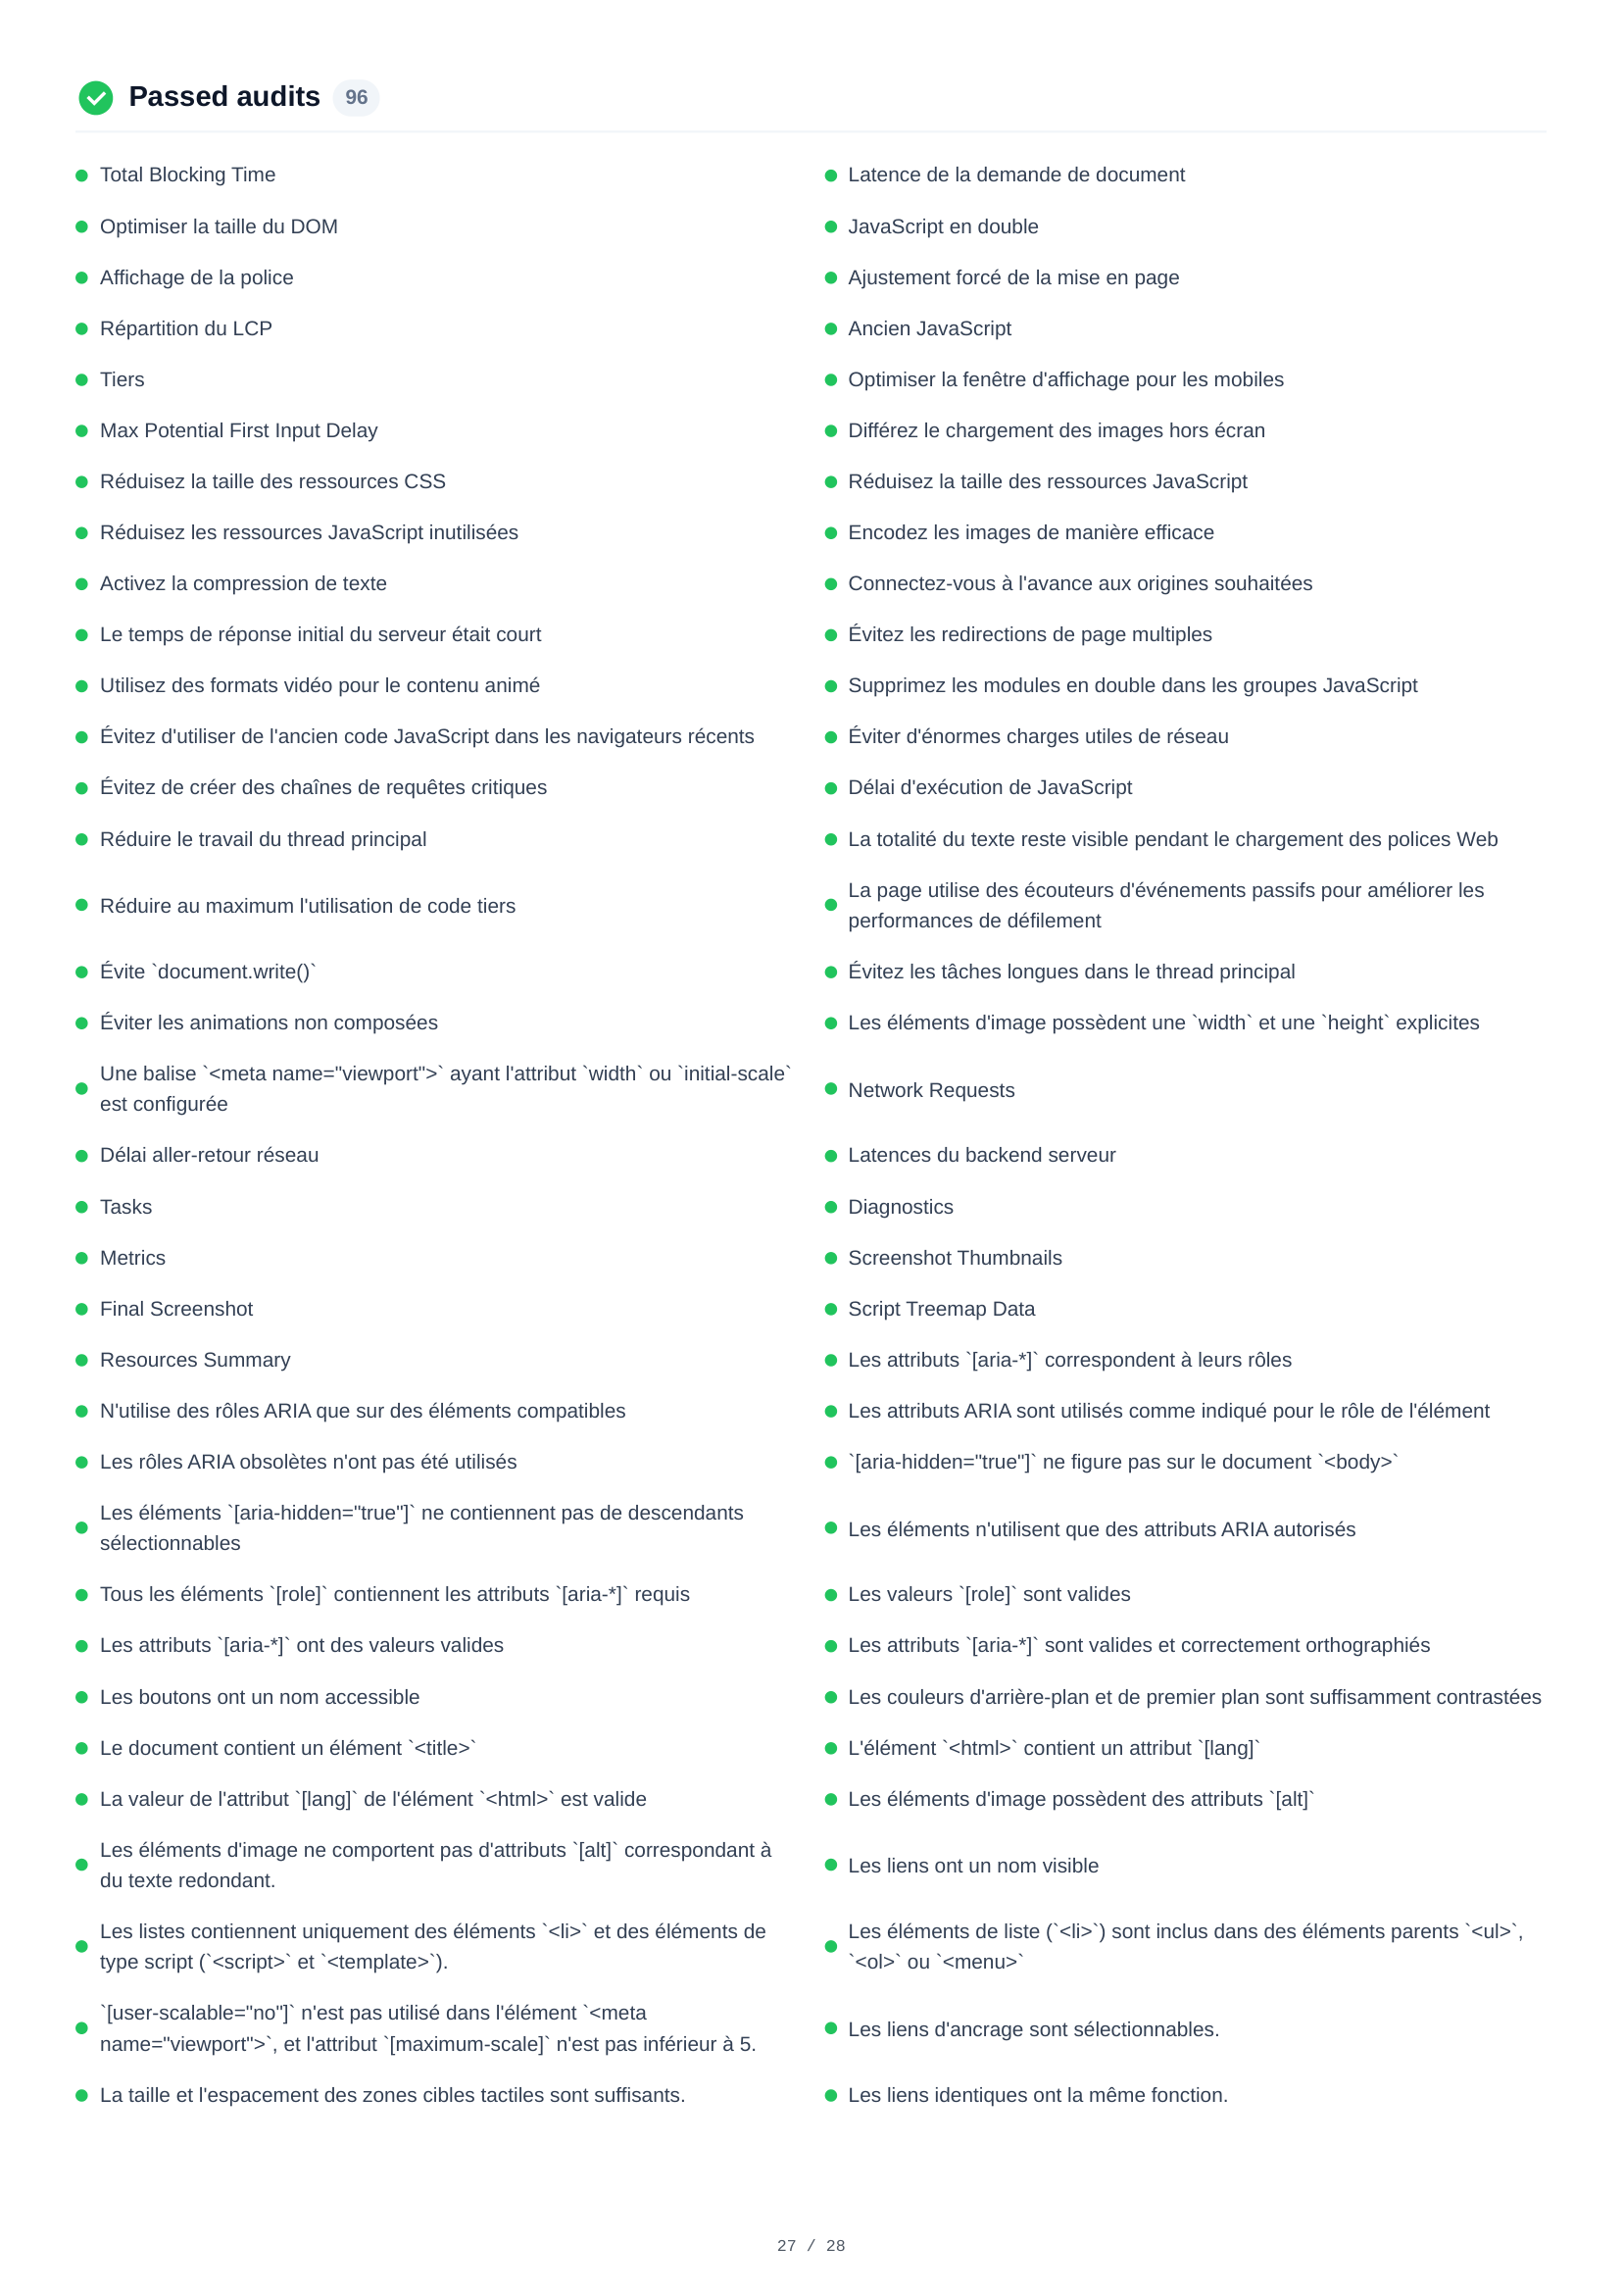
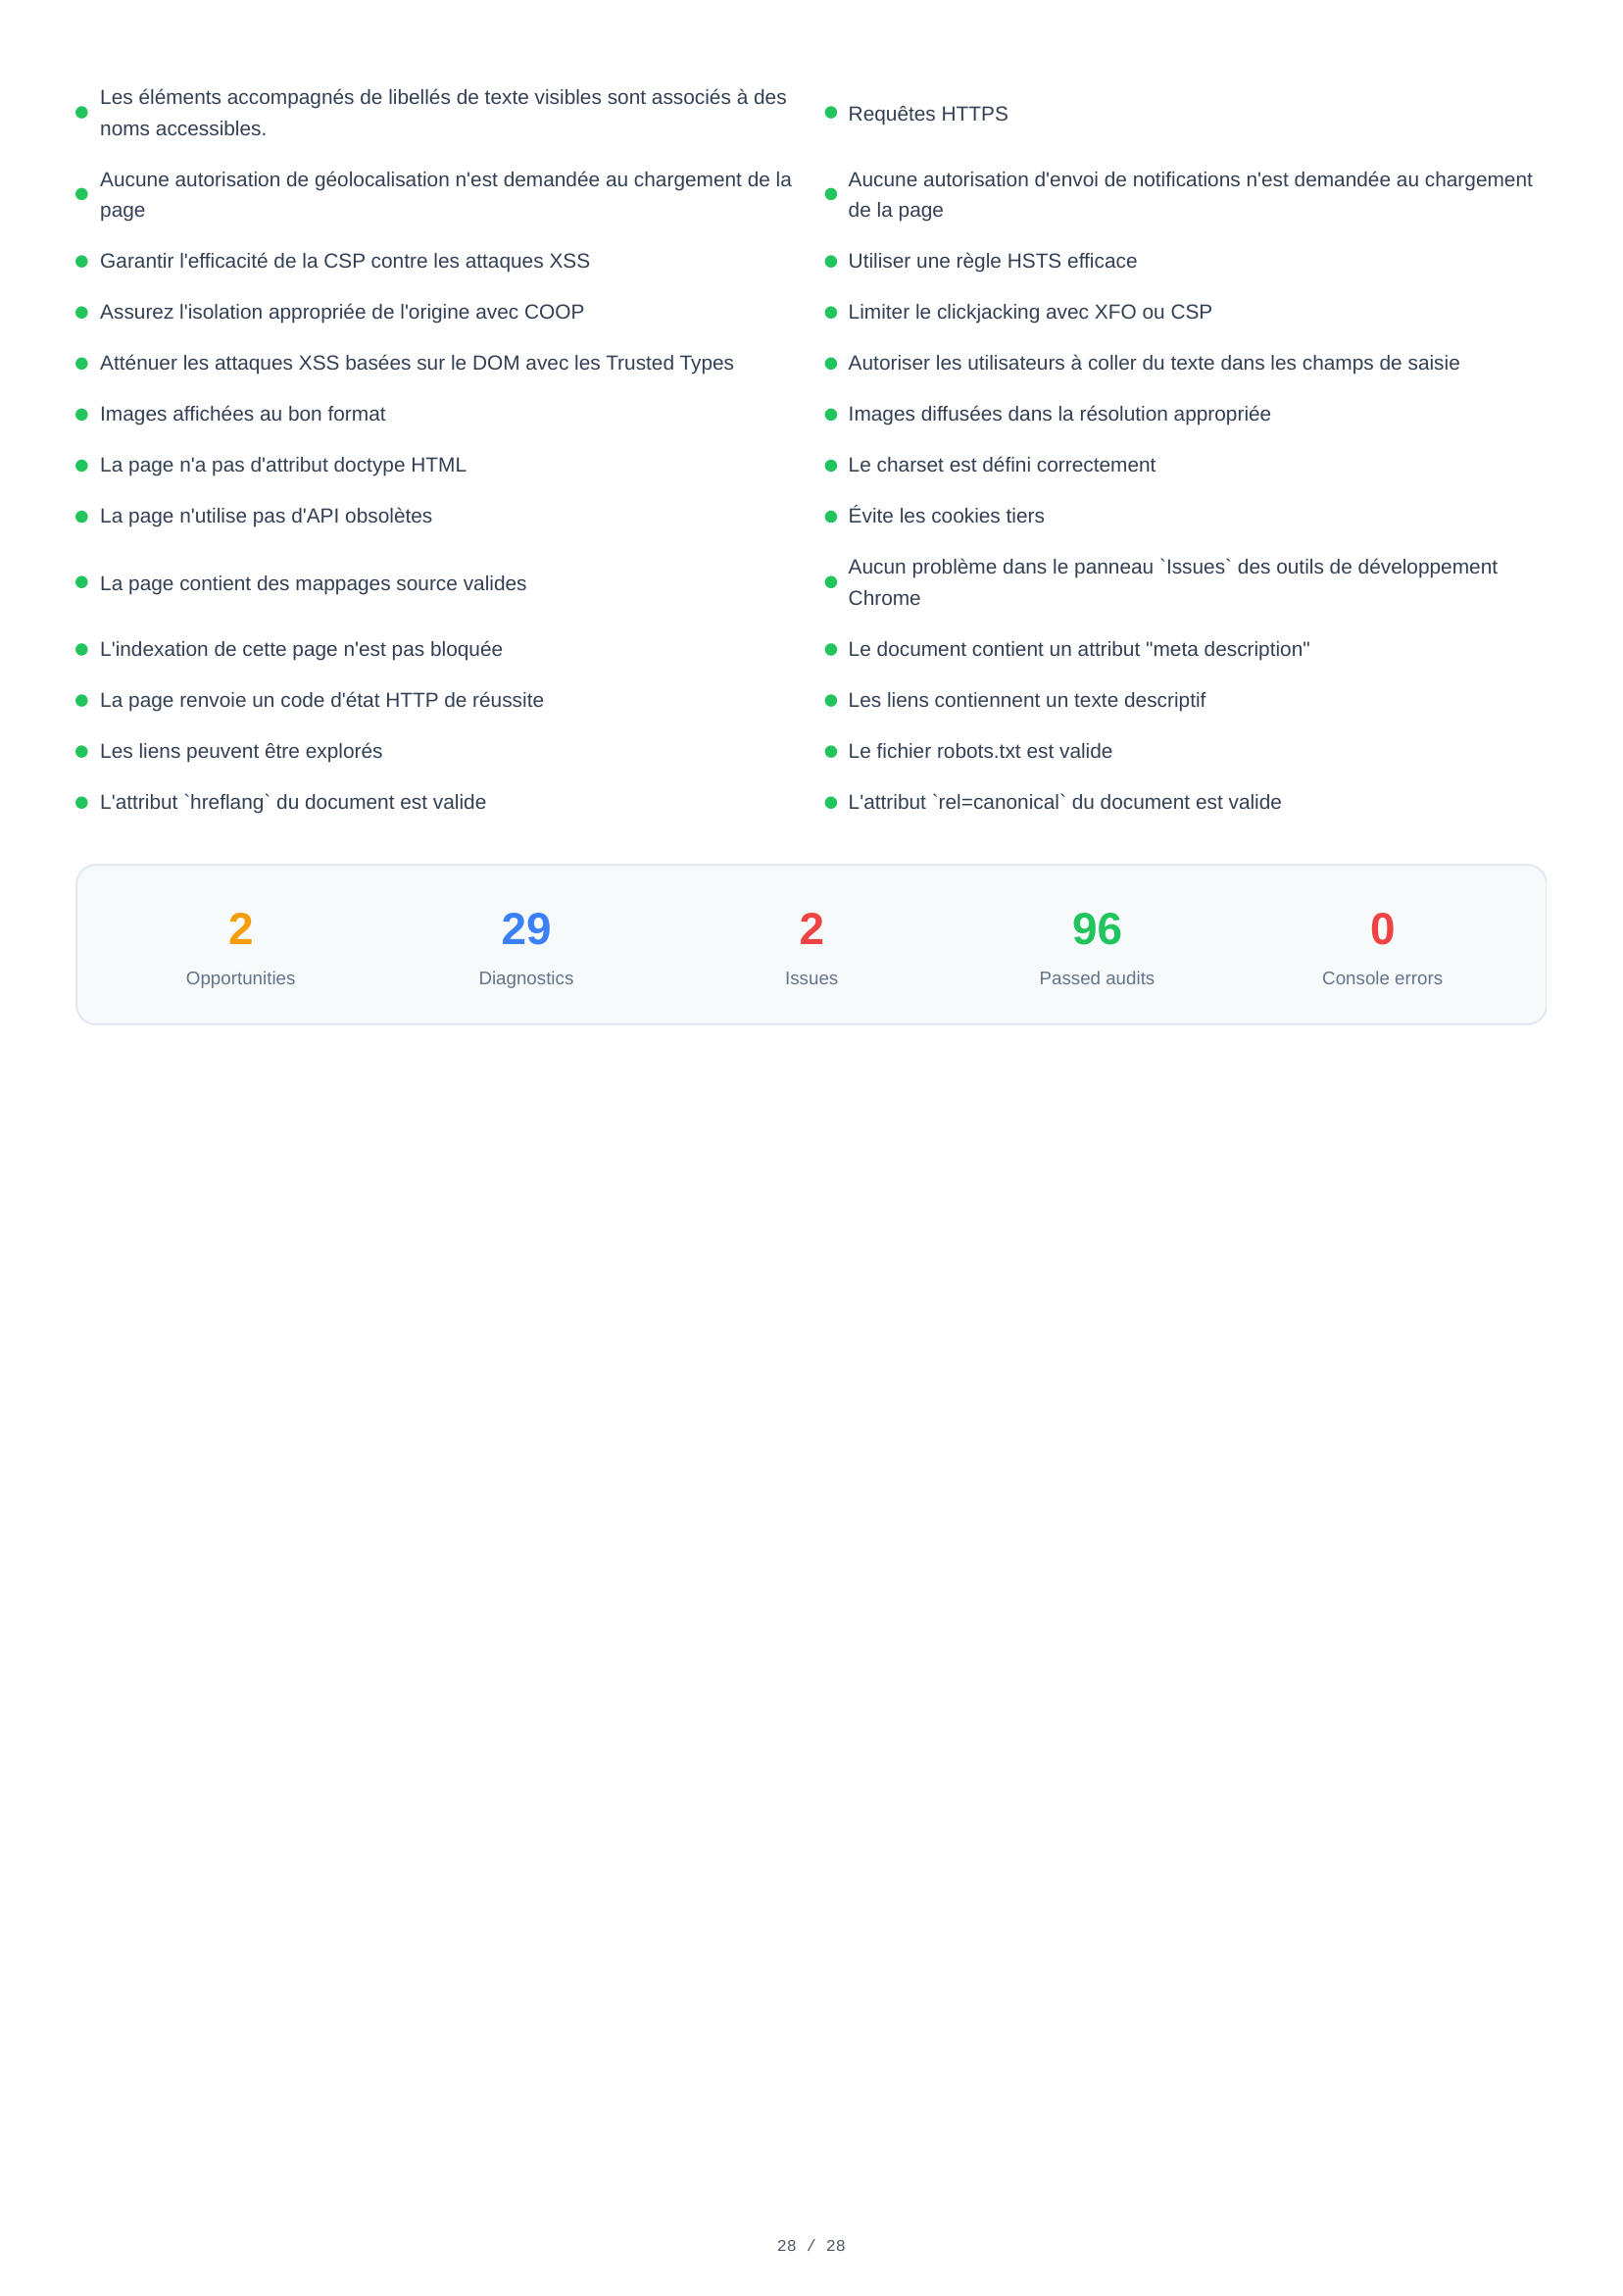
Desktop Passed Audits
96 audits passed on desktop — 2 more than mobile — confirming strong overall compliance. The complete list covers performance optimizations, accessibility standards, security best practices, and SEO requirements the page successfully meets.
Key findings
Perfect SEO (100) and near-perfect accessibility (98) on both devices. One heading-order issue to fix.
A 2.3 MB background image accounts for nearly half the 4.9 MB page weight. Responsive sizing and a modern format would cut LCP by over 1 second.
No TTL on 6 static assets means repeat visitors re-download them every time. A cache policy is a one-line fix.
VitaPulse compares each scan against a reference baseline and flags drops in scores or Core Web Vitals — so you know when a deploy breaks performance.